Best Indicators for Day Trading: Top 10 Technical Indicators in 2026


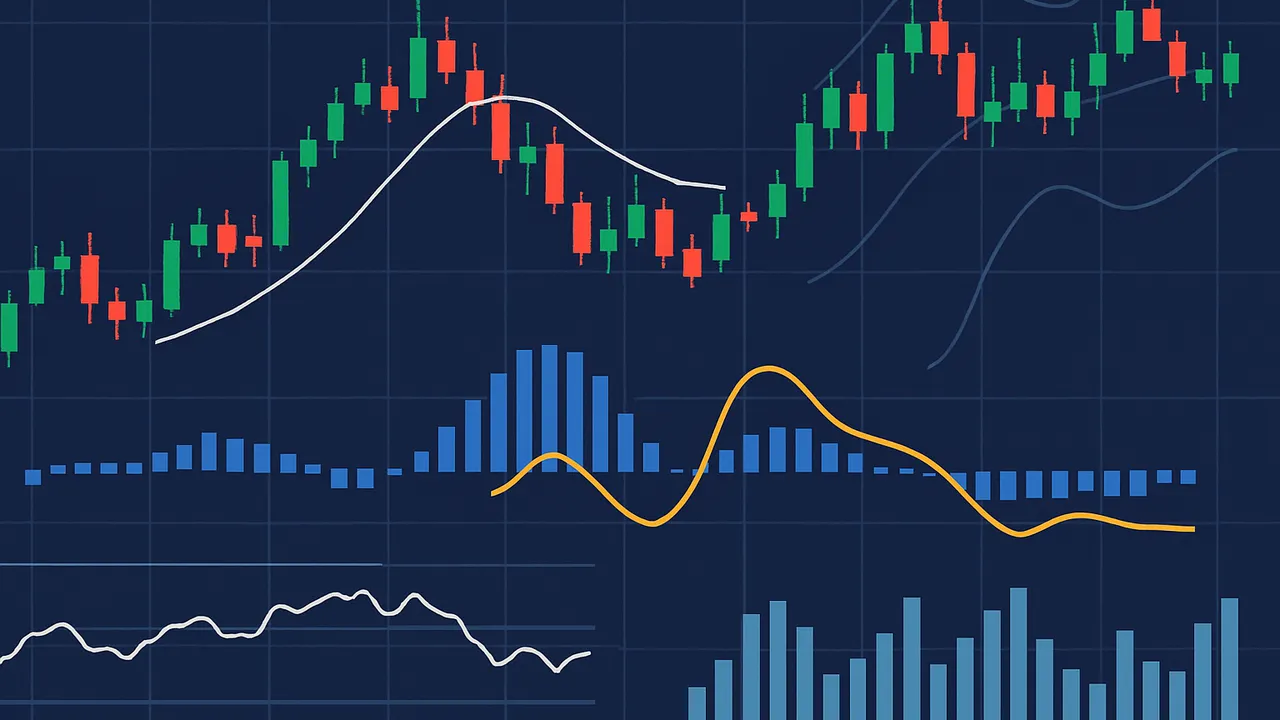
Choosing the right trading indicators can make analyzing the markets much easier—but no single indicator works in every situation. Whether you’re trading stocks, forex, or cryptocurrencies, combining the right tools can help you identify trends, measure momentum, and improve entry and exit timing. In this guide, we’ll explain the 10 best indicators for day trading, how they work, and the best ways to combine them for smarter trading decisions in 2026.
What Are Trading Indicators?
Trading indicators are mathematical calculations based on price, volume, or open interest that help traders analyze market behavior. Instead of predicting the future, they highlight patterns that can improve decision-making when combined with price action and risk management.
In technical analysis, indicators are used to identify trends, measure momentum, evaluate volatility, and confirm potential entry or exit points. Whether you’re trading stocks, forex, or cryptocurrencies, understanding what trading indicators are is one of the first steps toward building a consistent trading strategy.
Most indicators in trading fall into two categories: leading indicators and lagging indicators. Leading indicators attempt to signal potential price moves before they happen, while lagging indicators confirm trends that are already underway. Experienced traders often combine both to reduce false signals and improve trade accuracy.
Leading vs. Lagging Indicators
| Leading Indicators | Lagging Indicators |
|---|---|
| Relative Strength Index (RSI) | Moving Average (MA) |
| Stochastic Oscillator | MACD |
| Williams %R | Average Directional Index (ADX) |
Tip: If you’re wondering what are leading indicators in trading, they’re best used to spot potential reversals, while lagging indicators are more reliable for confirming existing trends.
Why Traders Use Technical Indicators
No single indicator guarantees profitable trades, but the right combination can help traders make more informed decisions. Technical indicators simplify market data into visual signals, making it easier to understand price behavior across different timeframes.
Traders typically use technical indicators to:
- Identify trends and determine whether the market is moving upward, downward, or sideways.
- Measure momentum to see if buying or selling pressure is strengthening or fading.
- Analyze volatility and estimate how much prices are likely to fluctuate.
- Confirm trading volume, helping distinguish genuine breakouts from false moves.
- Improve trade timing by combining multiple signals before entering or exiting a position.
For example, a trader might use an EMA to identify the prevailing trend, RSI to check whether the market is overbought or oversold, and Volume to confirm whether a breakout has enough market participation. This layered approach is generally more reliable than relying on a single indicator alone.
The 10 Best Indicators for Day Trading
No technical indicator works perfectly on its own. The best indicators for day trading provide different types of market information, which is why experienced traders often combine two or three complementary tools instead of relying on a single signal.
Quick Comparison
| Indicator | Trend | Momentum | Volatility | Beginner Friendly |
|---|---|---|---|---|
| RSI | ⭐ | ⭐⭐⭐ | — | ⭐⭐⭐ |
| MACD | ⭐⭐⭐ | ⭐⭐ | — | ⭐⭐ |
| EMA | ⭐⭐⭐ | ⭐ | — | ⭐⭐⭐ |
| VWAP | ⭐⭐⭐ | — | — | ⭐⭐⭐ |
| Bollinger Bands | ⭐ | ⭐⭐ | ⭐⭐⭐ | ⭐⭐ |
1. Relative Strength Index (RSI)
What it measures: Momentum and overbought/oversold conditions.
Best for: Identifying potential reversals during ranging or mildly trending markets.
Pros
- Easy for beginners to understand
- Highlights potential reversal zones
- Works well across stocks, forex, and crypto
Cons
- Can stay overbought or oversold during strong trends
- Generates false signals in highly volatile markets
Best settings: 14-period RSI
Works best with: EMA or MACD for trend confirmation
2. Moving Average Convergence Divergence (MACD)
What it measures: Trend direction and momentum.
Best for: Confirming trend changes and identifying momentum shifts.
Pros
- Reliable trend confirmation
- Easy-to-read crossover signals
- Suitable for most markets
Cons
- Reacts after price has already moved
- Less effective in sideways markets
Best settings: 12, 26, 9
Works best with: RSI or Volume
3. Exponential Moving Average (EMA)
What it measures: Trend direction using recent price data.
Best for: Following short-term trends and dynamic support or resistance.
Pros
- Responds faster than SMA
- Excellent trend filter
- Simple to apply
Cons
- Can produce whipsaws in choppy markets
Best settings: 9 EMA, 20 EMA, or 50 EMA
Works best with: RSI, VWAP, or MACD
4. Volume Weighted Average Price (VWAP)
What it measures: The average price weighted by trading volume throughout the day.
Best for: Intraday trading and institutional price benchmarks.
Pros
- Widely used by professional traders
- Helps identify fair value
- Excellent for intraday entries
Cons
- Primarily designed for day trading
- Less useful on higher timeframes
Best settings: Default
Works best with: Volume and EMA
5. Bollinger Bands
What it measures: Price volatility around a moving average.
Best for: Identifying potential breakouts and overextended price moves.
Pros
- Visualizes volatility clearly
- Useful for breakout strategies
- Helps spot price extremes
Cons
- Doesn’t indicate trend direction on its own
Best settings: 20-period MA with 2 standard deviations
Works best with: RSI or MACD
6. Volume
What it measures: Trading activity behind price movements.
Best for: Confirming breakouts and trend strength.
Pros
- Confirms market conviction
- Helps avoid false breakouts
- Works across all asset classes
Cons
- Doesn’t provide entry signals by itself
Best settings: Default
Works best with: VWAP, EMA, or MACD
7. Stochastic Oscillator
What it measures: Momentum by comparing closing prices with recent trading ranges.
Best for: Spotting short-term reversals.
Pros
- Effective in range-bound markets
- Provides early reversal signals
Cons
- Can produce frequent false signals in strong trends
Best settings: 14, 3, 3
Works best with: RSI or Bollinger Bands
8. Average Directional Index (ADX)
What it measures: Trend strength rather than trend direction.
Best for: Determining whether a market is trending strongly enough to trade.
Pros
- Filters weak market conditions
- Improves trend-following strategies
Cons
- Doesn’t indicate bullish or bearish direction
Best settings: 14
Works best with: EMA or MACD
9. Average True Range (ATR)
What it measures: Market volatility.
Best for: Setting stop-losses and position sizing.
Pros
- Excellent risk management tool
- Adapts to changing volatility
Cons
- Doesn’t predict market direction
Best settings: 14
Works best with: Trend indicators such as EMA or ADX
10. Fibonacci Retracement
What it measures: Potential support and resistance levels based on Fibonacci ratios.
Best for: Identifying pullback entry opportunities.
Pros
- Popular among professional traders
- Helps define profit targets and support zones
Cons
- Subjective anchor points
- Best used with confirmation indicators
Best settings: 23.6%, 38.2%, 50%, 61.8%, 78.6%
Works best with: EMA, RSI, or Volume
Top 10 Trading Indicators at a Glance
| Indicator | Best For |
|---|---|
| RSI | Momentum |
| MACD | Trend |
| EMA | Trend |
| VWAP | Intraday Trading |
| Bollinger Bands | Volatility |
| ATR | Risk Management |
| ADX | Trend Strength |
| Volume | Breakout Confirmation |
| Stochastic | Reversal Signals |
| Fibonacci Retracement | Support & Resistance |
Trading Indicators Cheat Sheet
| Trading Goal | Recommended Indicator |
|---|---|
| Spot the trend | EMA |
| Measure momentum | RSI |
| Confirm trend | MACD |
| Assess volatility | ATR |
| Time intraday entries | VWAP |
Which Indicators Should Beginners Start With?
If you’re new to technical analysis, avoid using too many indicators at once. A simple combination of EMA, RSI, and MACD covers trend, momentum, and confirmation without making your charts overly complicated. Once you’re comfortable reading these signals, you can gradually add tools like VWAP or ATR to refine your trading strategy.
Ready to Put These Indicators into Action?
Analyze markets with TradingView charts and trade over 400 crypto assets on BTCC.
 You can claim a welcome reward of up to 30,000 USDT
Best Indicator Combinations
The most successful traders rarely rely on a single indicator. Instead, they combine indicators that measure different aspects of the market—such as trend, momentum, volatility, and volume—to reduce false signals and improve trade confidence.
A good rule of thumb is to avoid using multiple indicators that provide the same type of information. For example, pairing RSI with Stochastic may add little value because both measure momentum. A stronger setup combines indicators that complement each other.
| Indicator Combination | Why It Works | Best For |
|---|---|---|
| RSI + EMA | EMA identifies the trend, while RSI helps time pullbacks and reversals. | Beginners & day traders |
| VWAP + Volume | VWAP shows the fair intraday price, and Volume confirms breakout strength. | Intraday & scalping |
| MACD + RSI | MACD confirms trend direction, while RSI highlights overbought or oversold conditions. | Trend-following |
| Bollinger Bands + ATR | Bollinger Bands identify volatility extremes, while ATR helps set realistic stop-loss levels. | Breakout trading |
Pro Tip: Two or three complementary indicators are usually enough. Adding more indicators often creates conflicting signals rather than improving accuracy.
Best Indicators for Different Trading Styles
There isn’t a single indicator that works for every market or strategy. The best trading indicators depend on your trading style, time horizon, and the assets you trade.
Best Indicators for Day Trading
The best indicators for day trading focus on short-term price movements and intraday momentum.
- VWAP – Tracks the average traded price throughout the day.
- EMA (9 & 20) – Identifies short-term trends.
- RSI – Spots overbought and oversold conditions.
- Volume – Confirms breakout strength.
These are also widely considered the best technical indicators for day trading, especially when used together.
Best Indicators for Swing Trading
Swing traders aim to capture price moves that develop over several days or weeks, so trend confirmation is often more important than precise entry timing.
The best swing trading indicators include:
- EMA (20 & 50)
- MACD
- ADX
- Fibonacci Retracement
These are among the best technical indicators for swing trading because they help identify trend direction, trend strength, and key pullback levels.
Best Indicators for Crypto Trading
Because cryptocurrencies are highly volatile and trade 24/7, traders often combine momentum and volatility indicators.
Some of the best indicators for crypto trading include:
- RSI
- EMA
- Bollinger Bands
- ATR
- Volume
These crypto trading indicators help traders identify trend reversals, breakout opportunities, and suitable stop-loss levels. Whether you’re trading Bitcoin or altcoins, combining trend and momentum indicators usually produces more reliable signals than using either alone.
Best Forex Trading Indicators
The forex market typically rewards trend-following strategies, making moving averages and momentum indicators particularly effective.
Popular forex trading indicators include:
- EMA
- MACD
- RSI
- ADX
Many forex traders also use Fibonacci Retracement to identify potential support and resistance levels during trending markets.
| Trading Style | Recommended Indicators |
|---|---|
| Day Trading | VWAP, EMA, RSI, Volume |
| Swing Trading | EMA, MACD, ADX, Fibonacci |
| Crypto Trading | RSI, EMA, ATR, Bollinger Bands |
| Forex Trading | EMA, MACD, RSI, ADX |
Common Mistakes When Using Indicators
Technical indicators are valuable tools, but they don’t guarantee profitable trades. Many beginners struggle because they rely on indicators incorrectly rather than understanding what each one is designed to measure.
Using Too Many Indicators
Adding five or six indicators to the same chart often creates information overload. Stick to two or three complementary indicators that measure different market conditions.
Ignoring Price Action
Indicators are based on historical price data, so price action should always come first. Support and resistance levels, trendlines, and candlestick patterns provide important context that indicators alone cannot.
Forgetting About Volume
A breakout without strong volume is more likely to fail. Whenever possible, use Volume or VWAP to confirm whether buyers or sellers are genuinely supporting the move.
Blindly Following Signals
An RSI reading above 70 doesn’t automatically mean it’s time to sell, just as a MACD crossover isn’t always a buy signal. Market conditions matter, and every signal should be confirmed before placing a trade.
Avoid These Common Errors
- ❌ Using multiple indicators that measure the same thing
- ❌ Ignoring the overall market trend
- ❌ Trading without volume confirmation
- ❌ Taking every indicator signal at face value
- ❌ Forgetting proper risk management
How to Choose the Right Indicator
The right indicator depends on your trading experience, preferred timeframe, and strategy. Rather than searching for a “perfect” indicator, choose tools that match how you trade.
| Trader Type | Recommended Indicators | Why |
|---|---|---|
| Beginner | EMA, RSI, MACD | Easy to understand and widely used |
| Scalper | VWAP, EMA, Volume | Designed for fast intraday decisions |
| Swing Trader | MACD, ADX, Fibonacci | Helps identify medium-term trends |
| Crypto Trader | RSI, EMA, ATR, Bollinger Bands | Handles high volatility effectively |
If you’re just starting, begin with one trend indicator (EMA), one momentum indicator (RSI), and one confirmation indicator (MACD). As you gain experience, you can add tools like ATR or VWAP to refine your strategy.
Trade with Technical Indicators on BTCC
Knowing how to read technical indicators is only part of the process—you also need a platform that makes market analysis and execution seamless.
BTCC integrates TradingView-powered charts with its trading interface, allowing you to analyze price action using popular technical indicators such as RSI, MACD, EMA, Bollinger Bands, VWAP, ATR, and Volume without switching between platforms. Once you’ve identified a setup, you can place spot or futures trades directly from the same interface.
Whether you’re testing the best indicators for crypto trading or building your own day trading strategy, BTCC provides access to over 400 crypto and tokenized assets, with spot trading, copy trading, demo trading, and futures trading with leverage of up to 250×.
Start Trading with BTCC
- TradingView charts integrated with trading
- Welcome rewards of up to 30,000 USDT for eligible new users
- Trade 400+ crypto and tokenized markets
- Spot, futures, copy trading, and demo trading on one platform
- Founded in 2011 with a strong security record and regulatory licenses in multiple jurisdictions, including Canada
You can claim a welcome reward of up to 30,000 USDT