Market-Wide Bitcoin Accumulation: Will BTC Challenge the $86,000 Resistance Zone?
 Odaily
Original author: Glassnode
Original translation: AididiaoJP, Foresight News
Key Takeaways
- Record short liquidations trigger a rebound, with Bitcoin facing a test of the dense supply zone between $81,000 and $86,000
- ETFs see a weekly net inflow of $2.23 billion, with all market cohorts accumulating simultaneously, providing clear capital support
- After deleveraging, the market rotates, and the $81,000–$86,000 range becomes a key resistance band above
Introduction
An unprecedented short liquidation event ignited a rebound of about 26% from the mid-August low. Unlike previous short-term squeezes driven purely by leverage, this rally is supported by substantial buying: U.S. spot ETFs recorded their strongest weekly inflows of the year, Bitcoin continued to flow out of exchanges, and all on-chain wallet size cohorts showed synchronized accumulation. The key question now is whether the rebound can extend to the January high, which depends on whether the dense supply zone between $81,000 and $86,000 can be effectively broken.
Liquidation Storm: The Largest Short Squeeze in History Ignites the Rebound
Record Single-Day Short Liquidations
In dollar terms, August 19, 2026, recorded the largest single-day short liquidation since data began in 2019. During the entire short squeeze window, short liquidations accounted for 85% of total liquidations. It should be noted that our data covers major centralized exchanges but does not include Hyperliquid, so the actual total liquidation amount is higher than our statistics.
The liquidation heatmap clearly shows how price consumed this "fuel." During the rebound, simulated liquidation clusters along the price path were triggered one by one, with about 86% of liquidation orders digested along the way. The remainder is distributed at both ends: above, the $82,000–$86,000 range has dense short liquidation orders, while below, the $60,500–$62,400 area retains long liquidation positions.

Significant Deleveraging
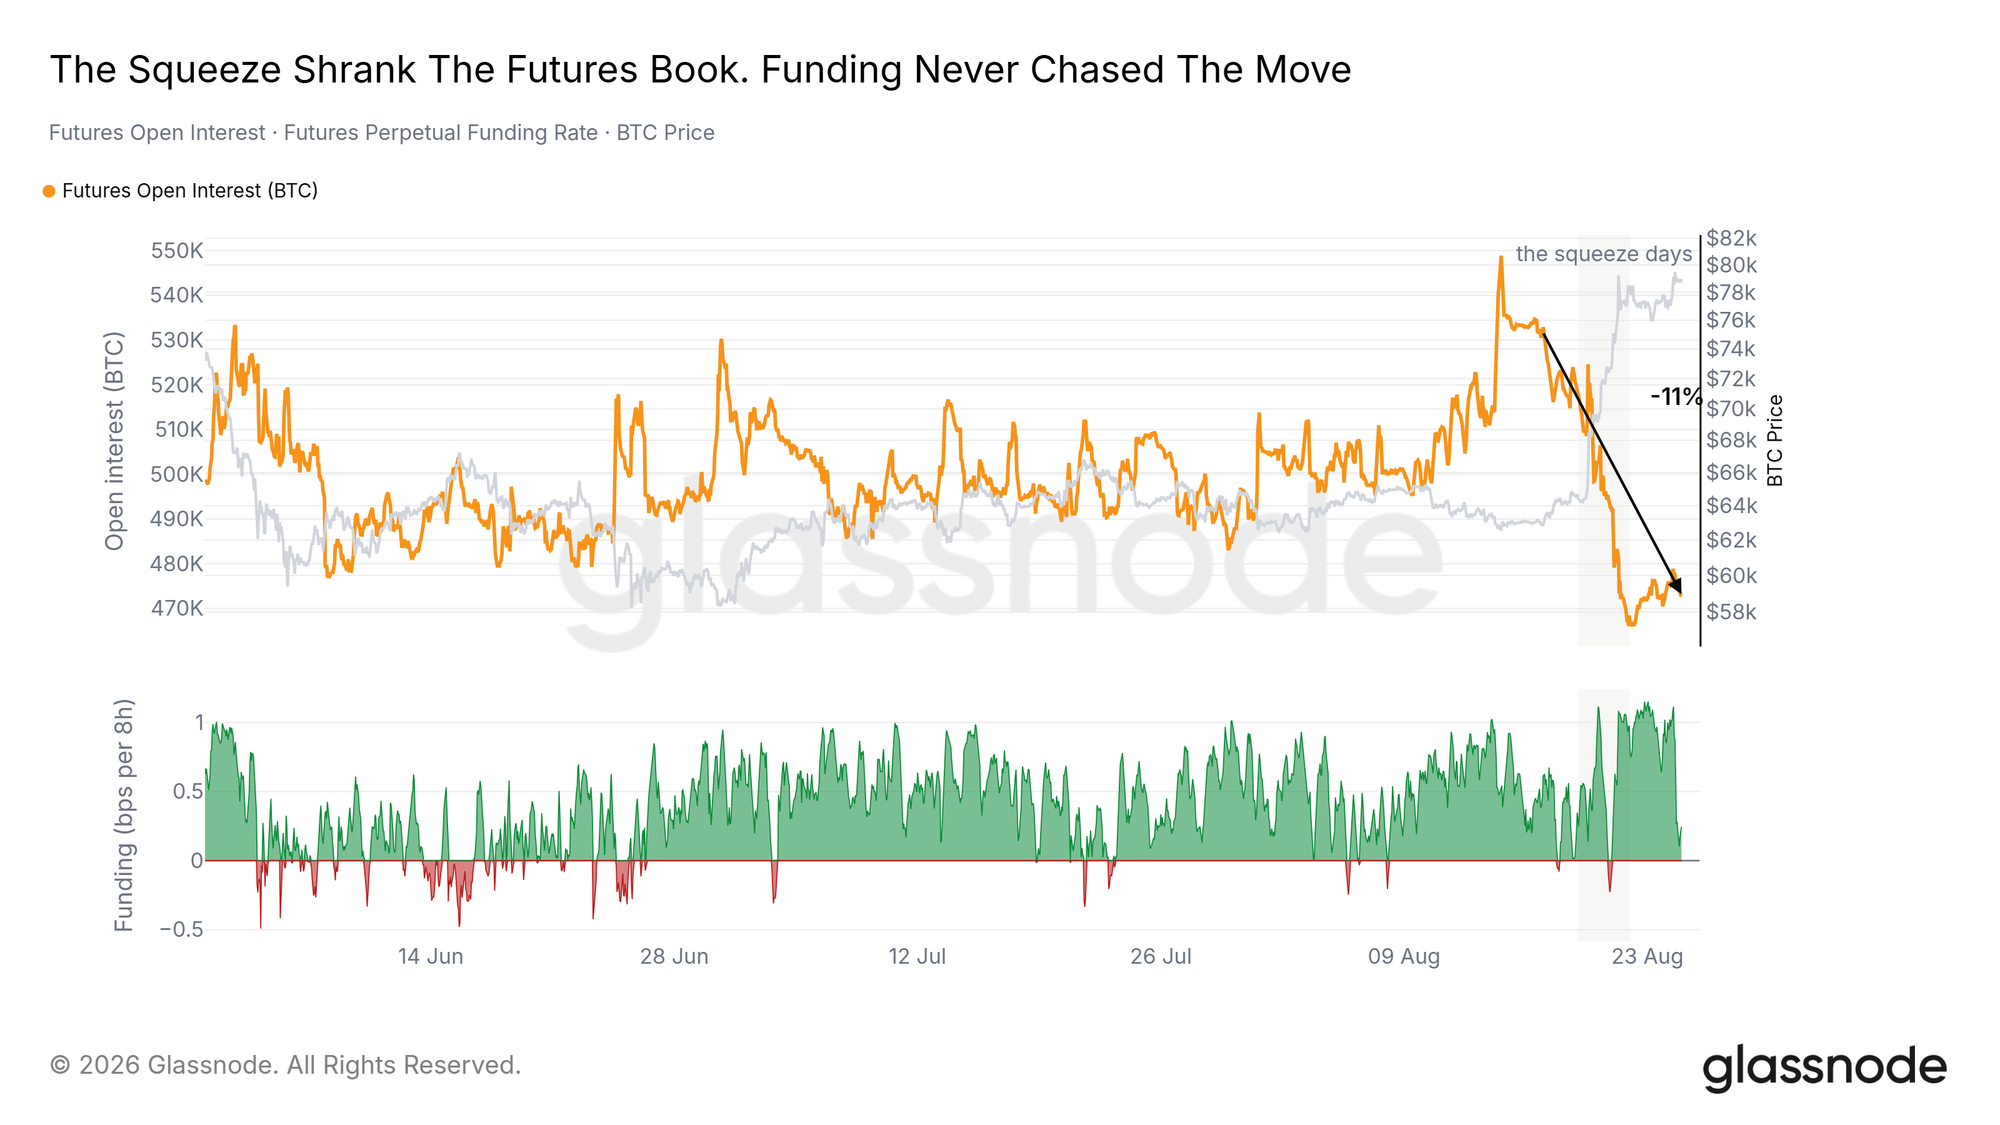
This squeeze effectively cleaned up leverage in the market. In Bitcoin terms, futures open interest contracted by 11% during the window, and the expansion in dollar nominal value was entirely driven by price increases—meaning that liquidated short positions were not quickly replenished by new contracts.
Perpetual funding rates also confirm this. Throughout the rebound, funding rates fluctuated around the neutral baseline, occasionally even turning negative. This indicates that the rebound was not driven by new longs chasing the rally, but rather by passive closing triggered by concentrated stop-losses. If Bitcoin-denominated open interest expands again and funding rates rise simultaneously, it would be the first warning signal of leverage re-entering the market.
Capital Verification: Real Money Backs the Rebound
ETF Channel Reactivated
U.S. spot Bitcoin ETFs recorded a net inflow of $2.23 billion during the short squeeze window, with no outflow days, setting the strongest weekly inflow record of the year. The largest single-day subscription was the highest since January 14, 2026. The price also reclaimed the short-term holder cost basis during the rebound.
Trading activity has picked up but is far from historical peaks: during the squeeze week, average daily ETF trading volume was about $2.4 billion, roughly half of the peak in January-February and about one-third lower than last August.

On-Chain Supply Shifts Up the Size Ladder
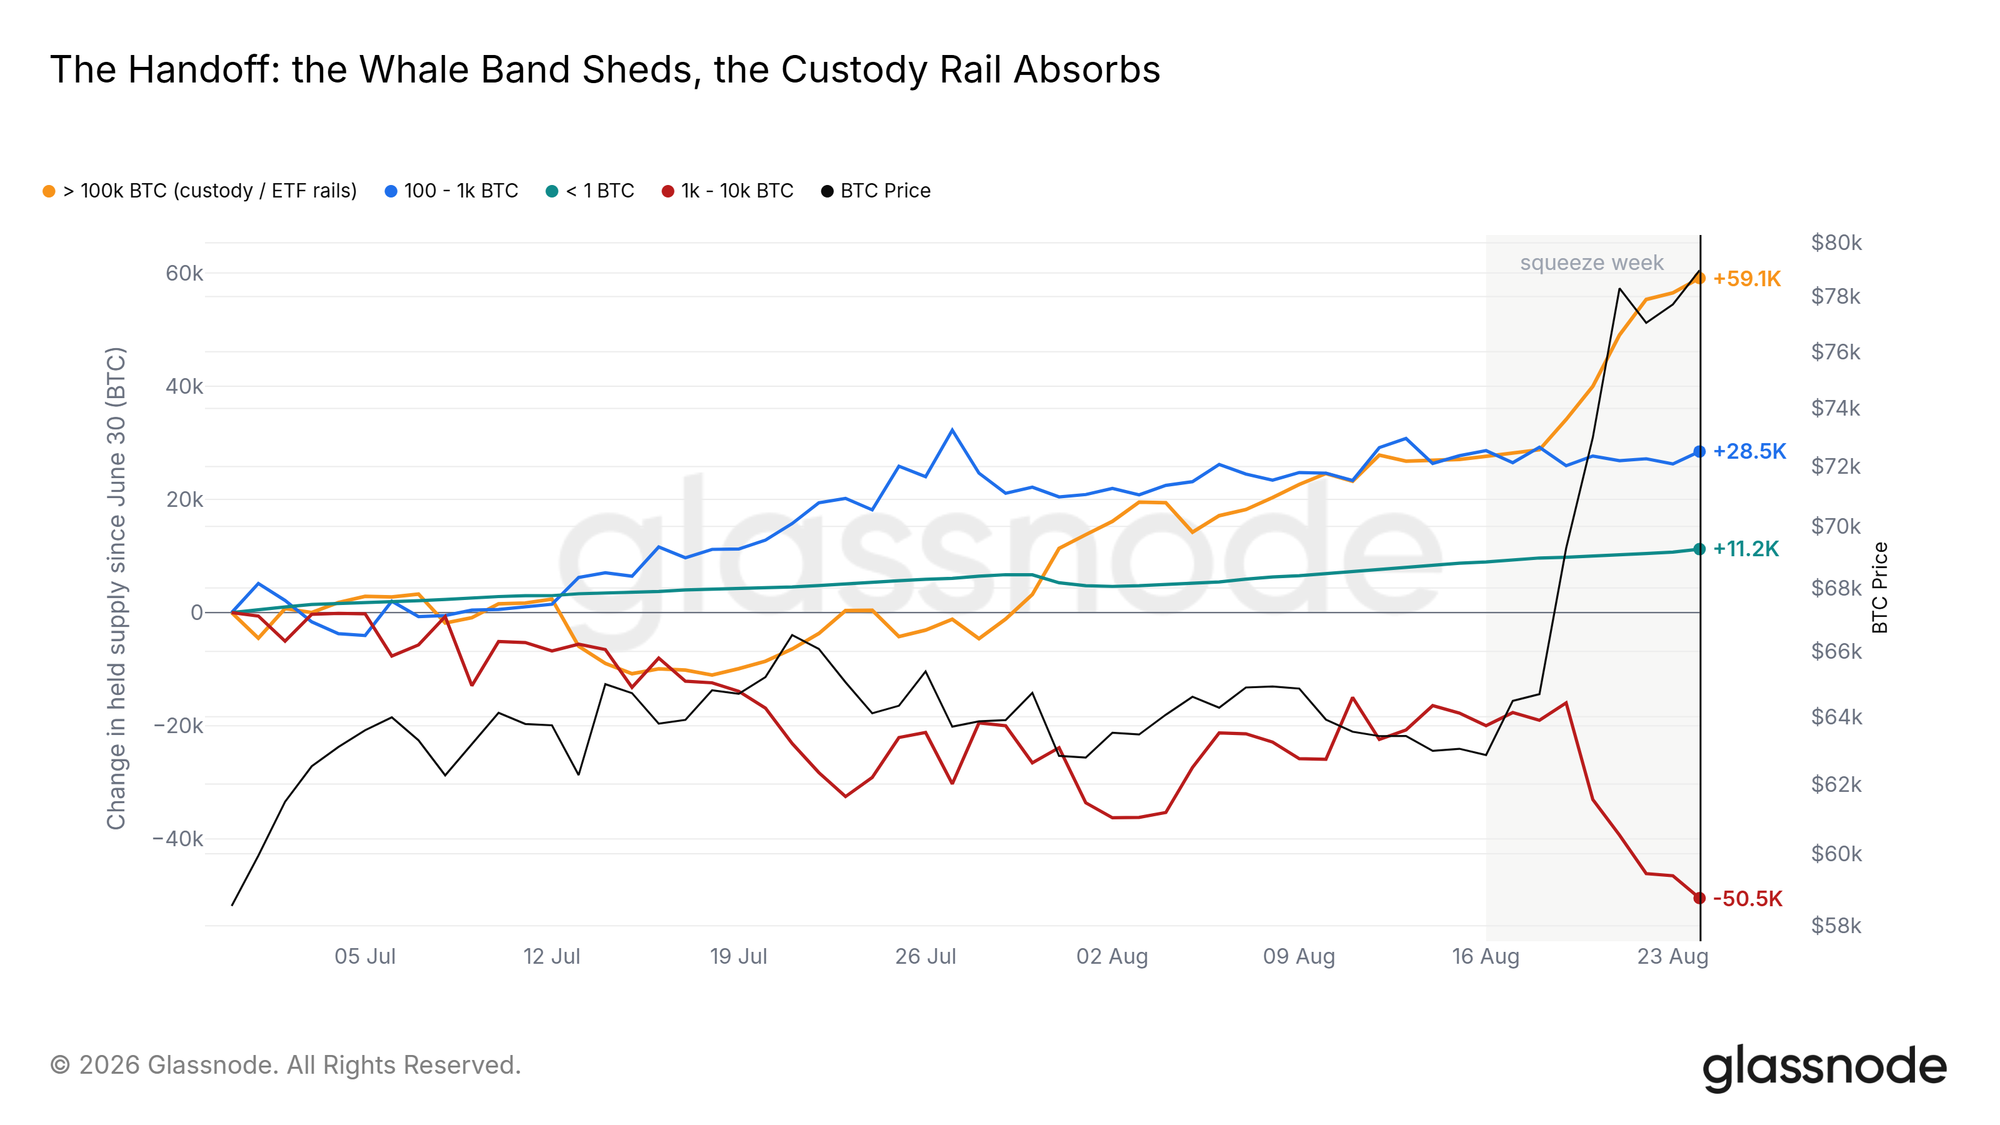
Since the low on June 30, 2026, entities holding 1,000–10,000 BTC have cumulatively reduced their holdings by about 50,500 BTC, while the largest cohort (over 100,000 BTC, mainly including exchanges, custodians, and ETF wrapper products) absorbed about 59,100 BTC over the same period. Capital is concentrating from small and medium-sized whales to large custodians along the size ladder.
This trend further strengthened during the squeeze week: the custodian cohort increased holdings by about 31,500 BTC during the window, comparable in size to the week's ETF net subscriptions (though not on a coin-by-coin basis). Coins flowing out of pressured whale wallets appeared in institutional custody channels at a similar scale.
All Market Cohorts Accumulating Simultaneously
The breadth of buying confirms the authenticity of capital inflows. The 30-day accumulation trend score shows that all six wallet size cohorts are at or above the neutral threshold of 0.5, a state that has persisted for 20 days since August 5, the longest synchronized accumulation cycle across all cohorts since the 22-day record in late 2024.
On the squeeze day, large wallets dominated the accumulation, while smaller cohorts had gradually completed their positioning throughout August. If any cohort's score falls back below 0.5, it would be the first signal of cracks in market breadth and indicate that the buying supporting this rebound is narrowing.

Rebound Structure: Cycle Positioning and Cross-Asset Performance
Cycle Indicator Exits Cooling Zone
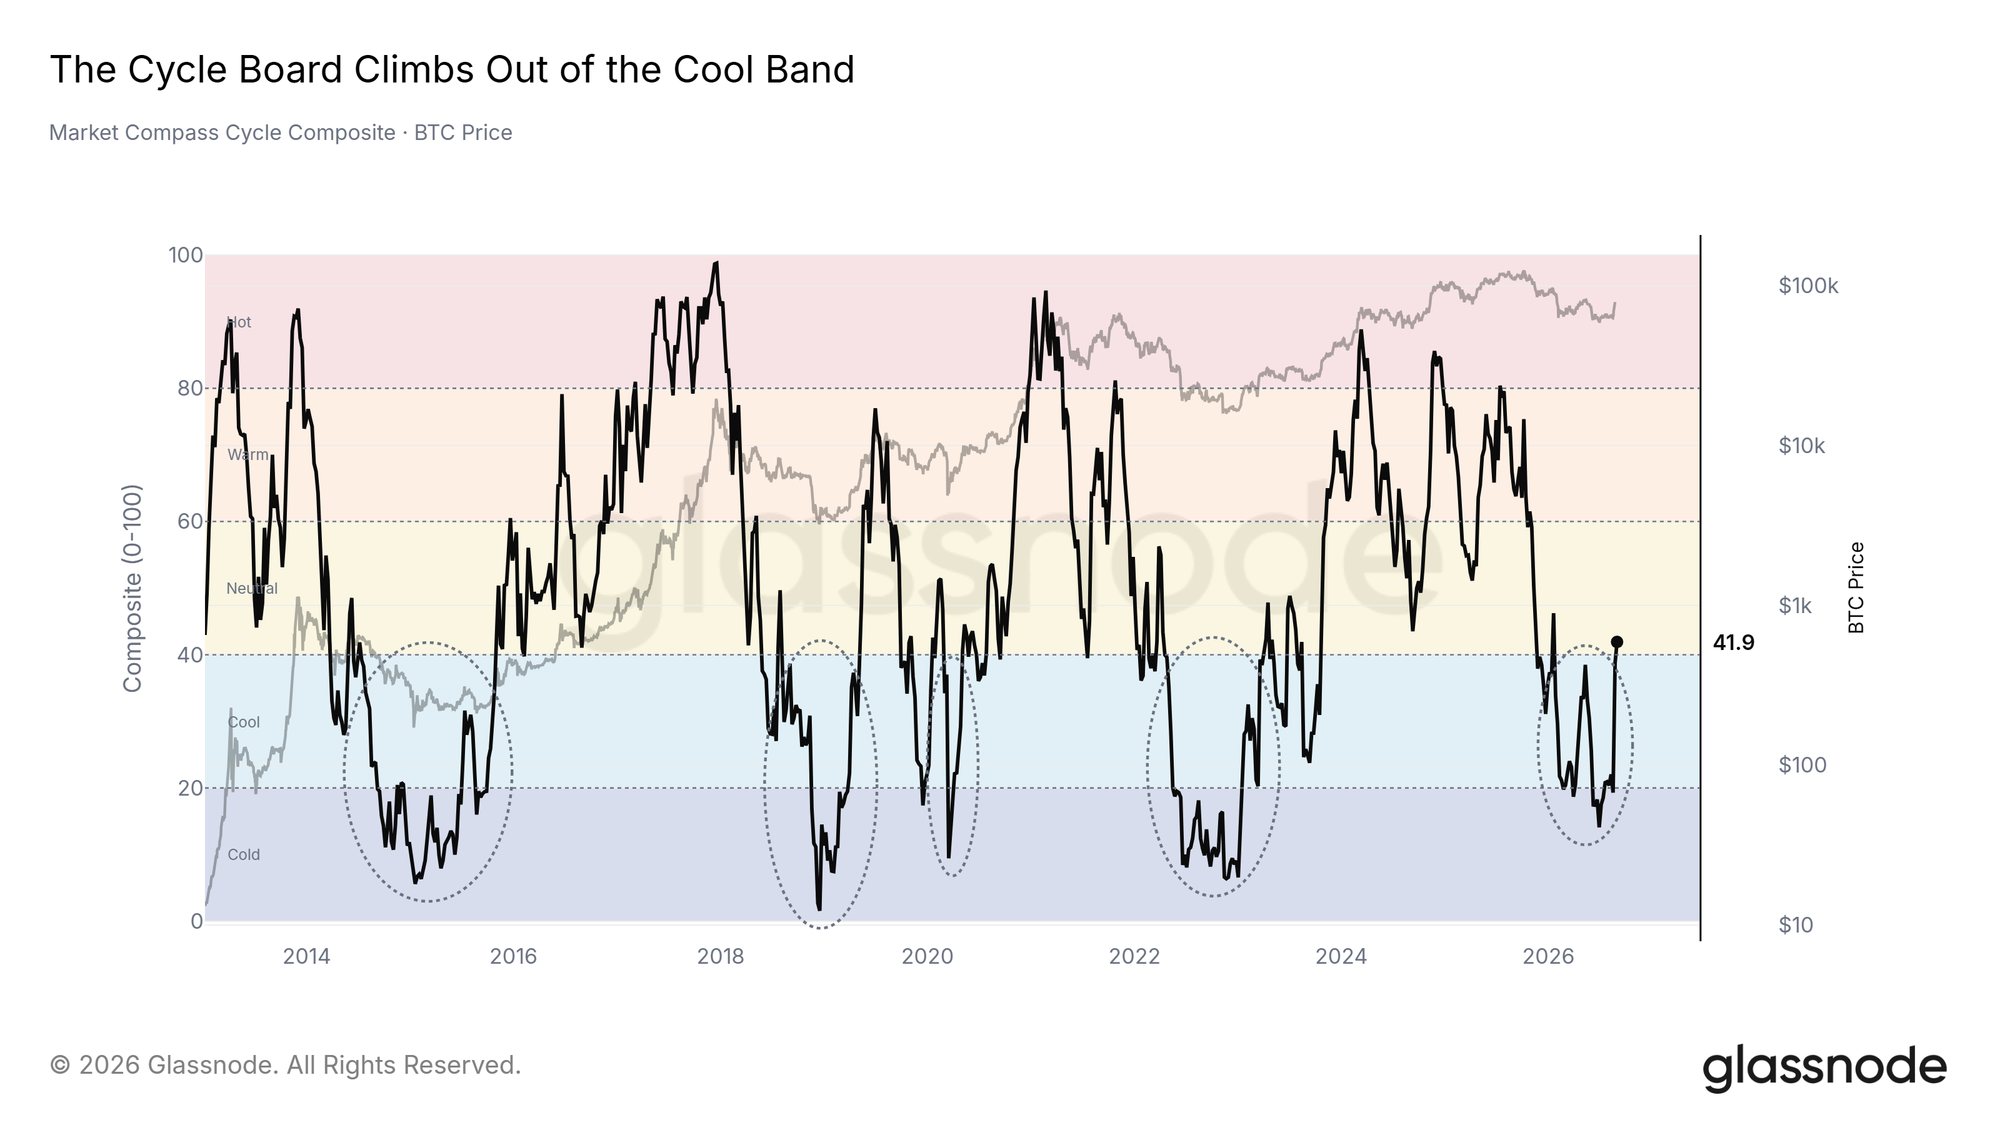
The cycle composite indicator (based on the median of 45 on-chain cycle indicators) has rebounded to the neutral boundary of 40, after staying in the "cold" to "cooling" range for seven months.
The five circles on the chart mark similar prolonged stays in history: 2014–2015, 2018–2019, 2020, 2022–2023, and the current cycle. Each corresponded to the low area of its respective cycle. This indicator does not predict the speed of the rebound, but it positions the current market in the early stage of the cycle, far from previous top readings.
Rebound Structure Shows "Top-Heavy" Characteristics
From a cross-asset perspective, the breadth of the rally is narrow. Over the past month, large-cap coins averaged a return of about 20.6%, roughly in line with Bitcoin; while small-cap coins only gained about 6.0%. The smaller the market cap, the less capital inflow it received.
This is a typical structure of an early rebound—the most liquid assets are allocated first. If small and mid-cap cohorts can catch up later, the rally will broaden; until then, this remains a market dominated by large caps, led by Bitcoin.

Significant Decoupling from U.S. Stocks
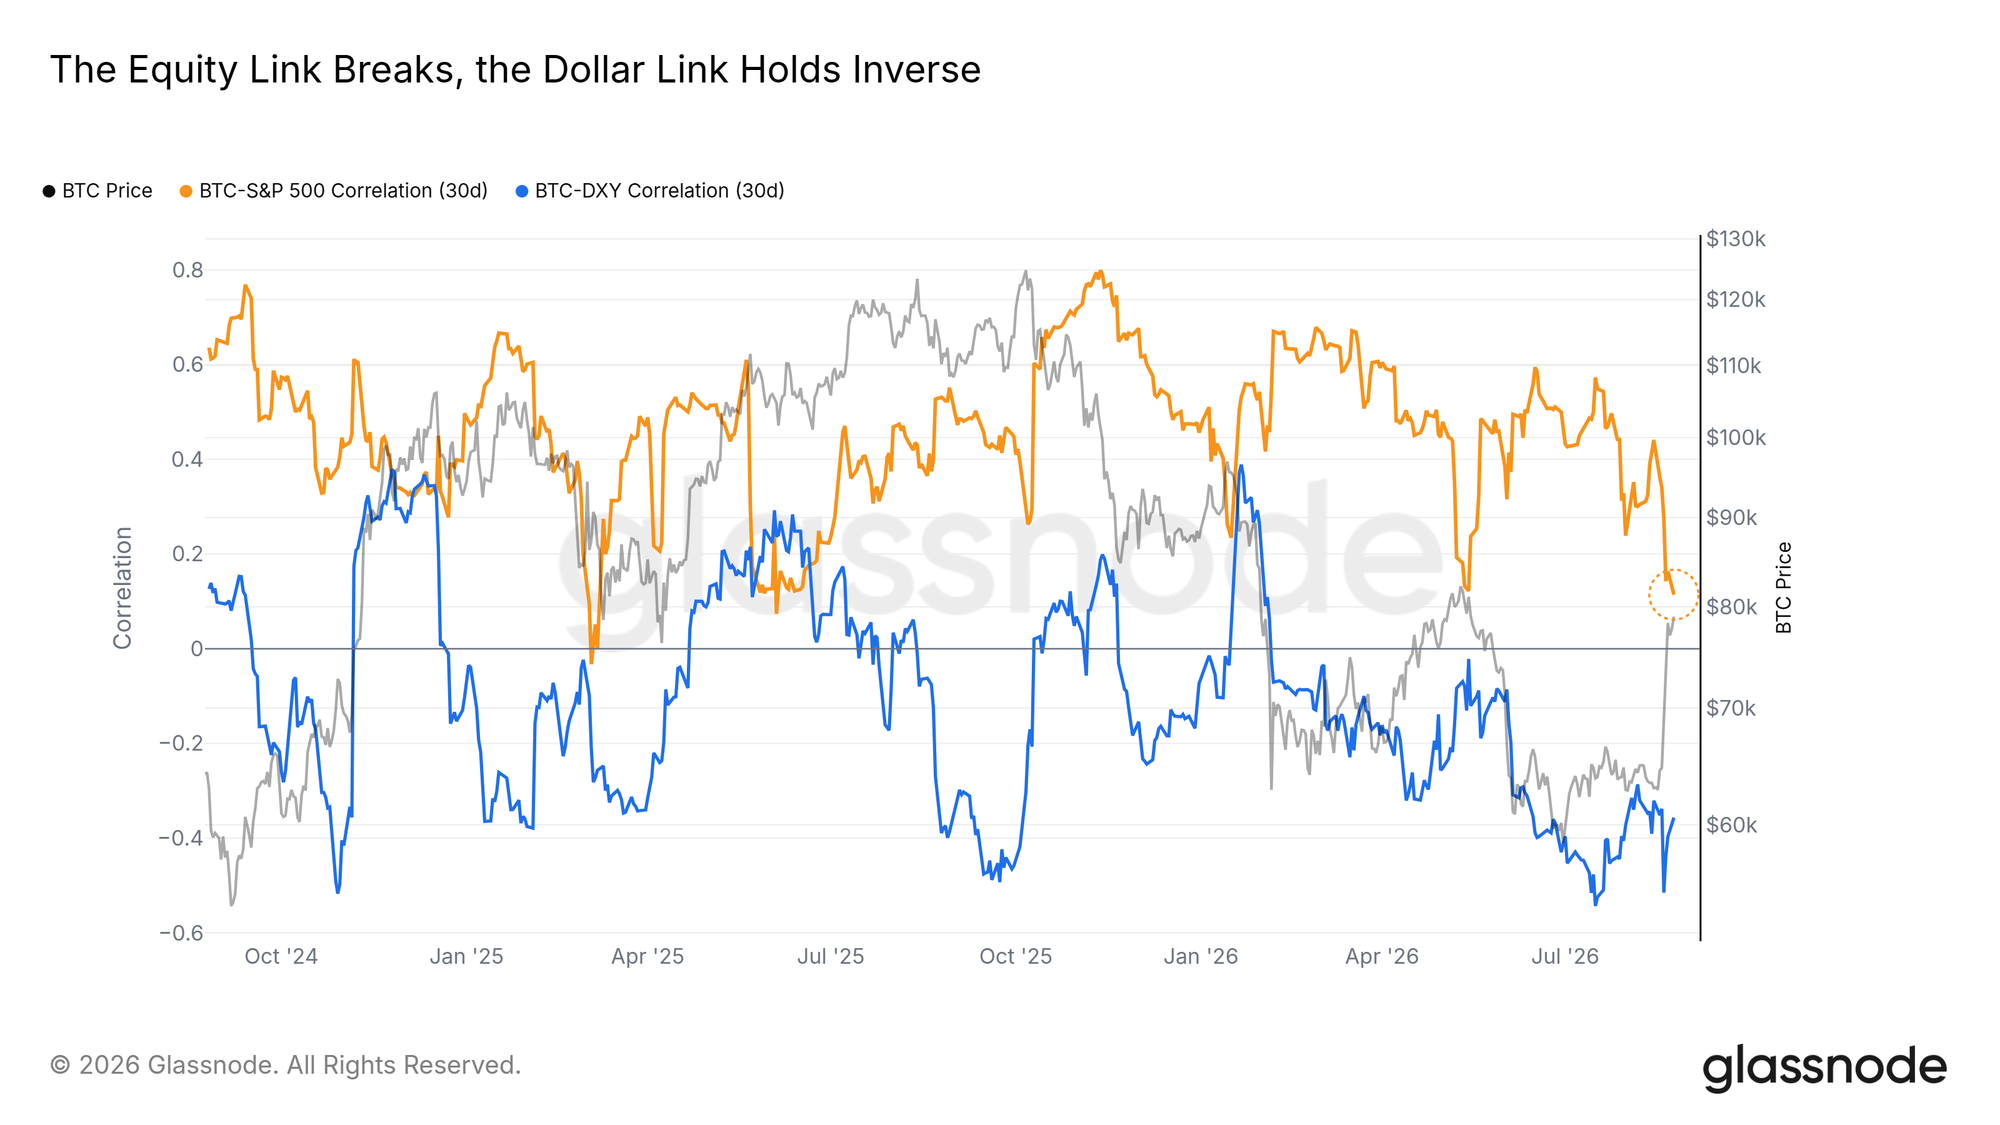
This rebound diverges from macro trends. During the short squeeze window, Bitcoin rose about 25%, while the S&P 500 fell 1.7% over the same period, and the one-month rolling return correlation between the two plummeted to near zero. The negative correlation with the dollar remains solid.
Similar rapid decoupling occurred twice in 2025 and mean-reverted within weeks, so it is too early to assert a structural shift—the quarterly window correlation has only just begun to turn downward. But a rebound completed against a backdrop of weak stock markets clearly does not belong to a "stock beta" trade; its true driver comes from capital inflows within the crypto market itself.
Overhead Resistance: The $81,000–$86,000 Dense Supply Zone
Cost Basis: Floor and Ceiling Coexist
The on-chain cost distribution has sandwiched the price. Below, buyers who entered at the June-August bottom hold the $62,000–$65,000 range, nearly two-thirds of which are short-term holders—recent buyers who tend to defend their cost line. Above, the first significant supply structure is at $83,000–$86,000, almost entirely composed of long-term holders who have experienced the full decline.
The current spot price is in the gap, and the short-term holder cost basis has risen to about $70,000 (below the price). An attack on $83,000–$86,000 will test whether long-term holders choose to sell near breakeven.

Seller Orders Re-Accumulate Above
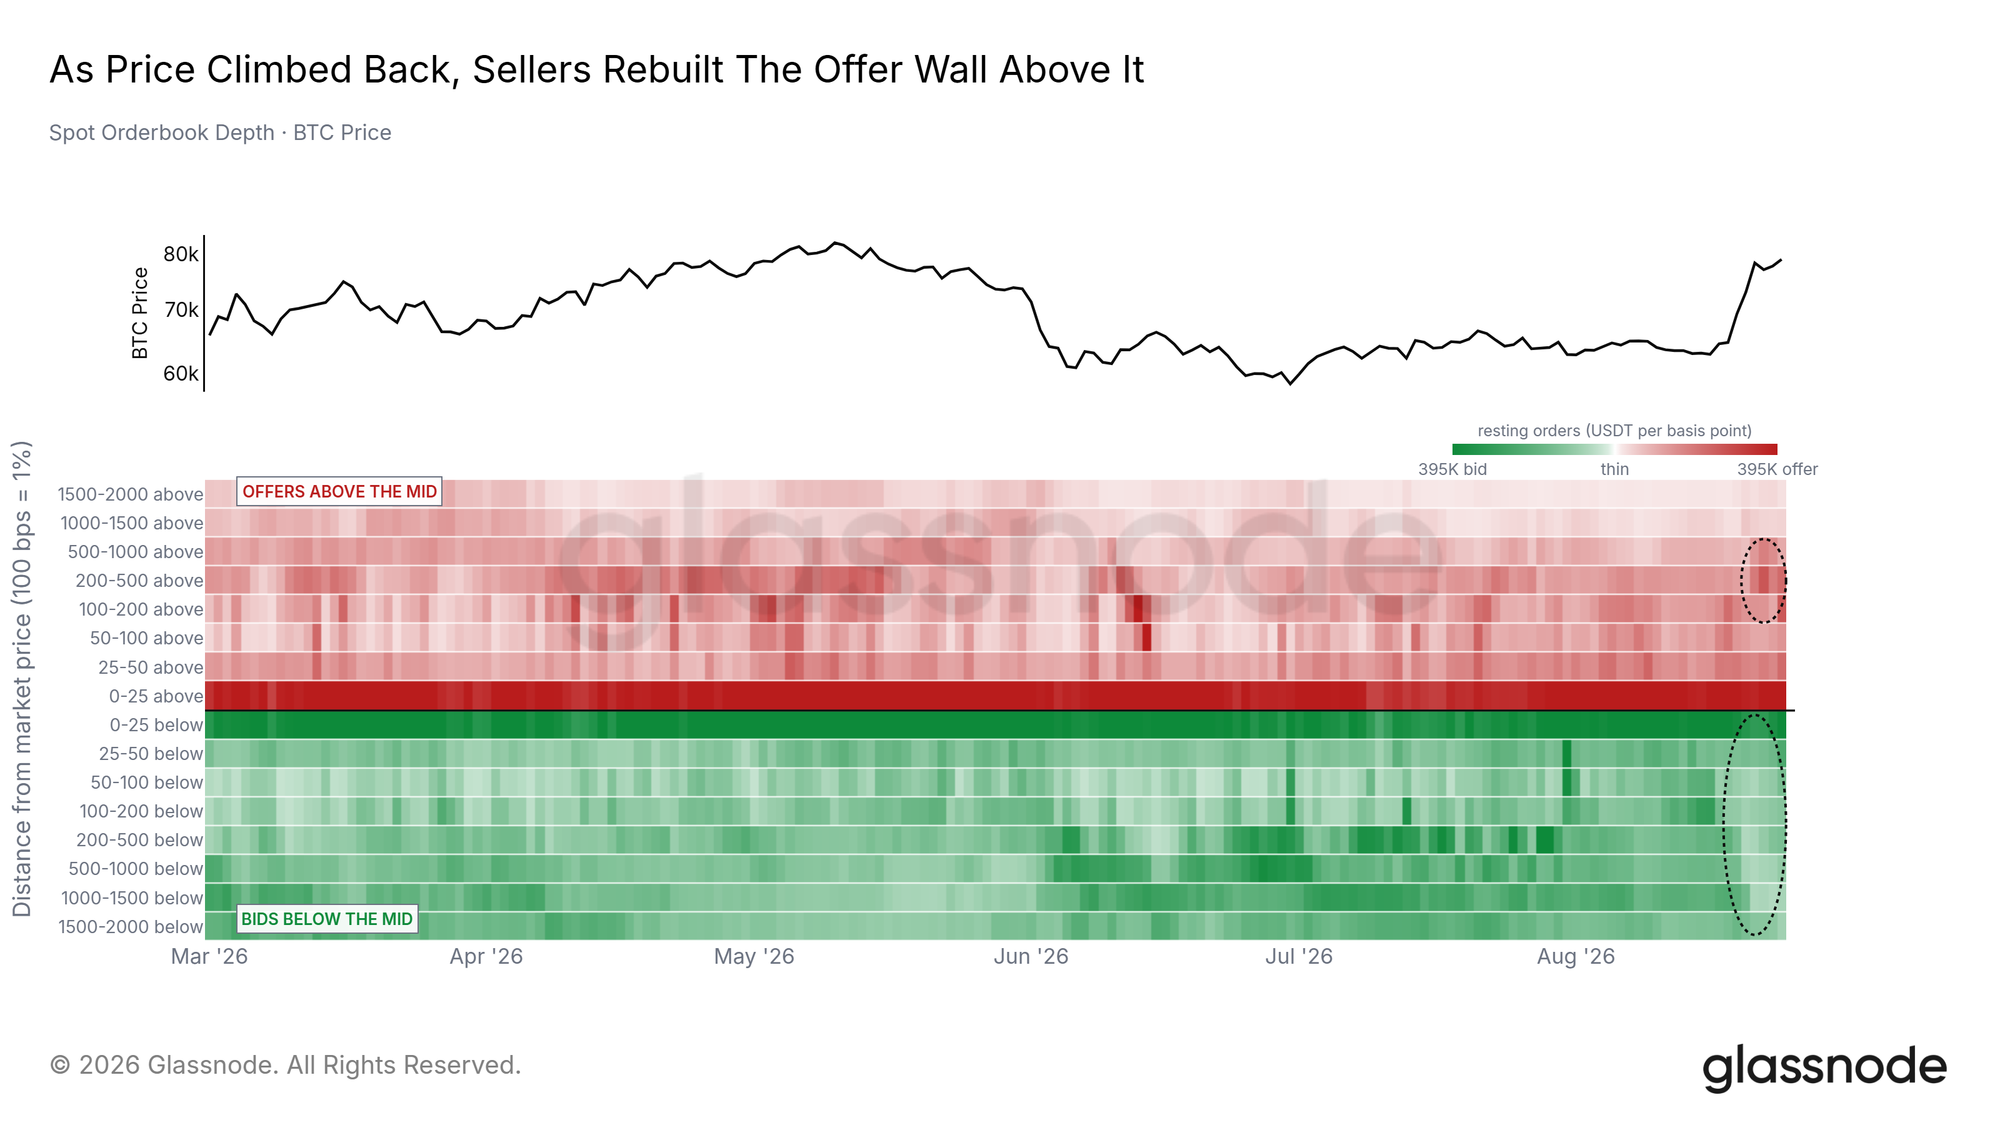
As the price rises, the order book re-posts sell orders above. Static sell orders in the 100–1000 basis point range above the mid-price grew by about 41% in the last five days of the window; while buy orders across the entire visible order book thinned by about 32% in the last seven days. Static orders can be canceled instantly, so the order book reflects the concentration of seller intent—currently sellers prefer to post orders above.
The re-accumulated sell orders and multiple independent indicators point to the same range: the first self-custody cost basis platform starts at $80,800, market maker gamma turns negative at $82,300, surviving liquidation orders extend to $86,000, and the patient supply wall fills the $83,000–$86,000 range. All overhead structures we track are currently concentrated between $81,000 and $86,000—this is the real test for the sustainability of the rebound.
Options Market Pricing: Expectation of Stability
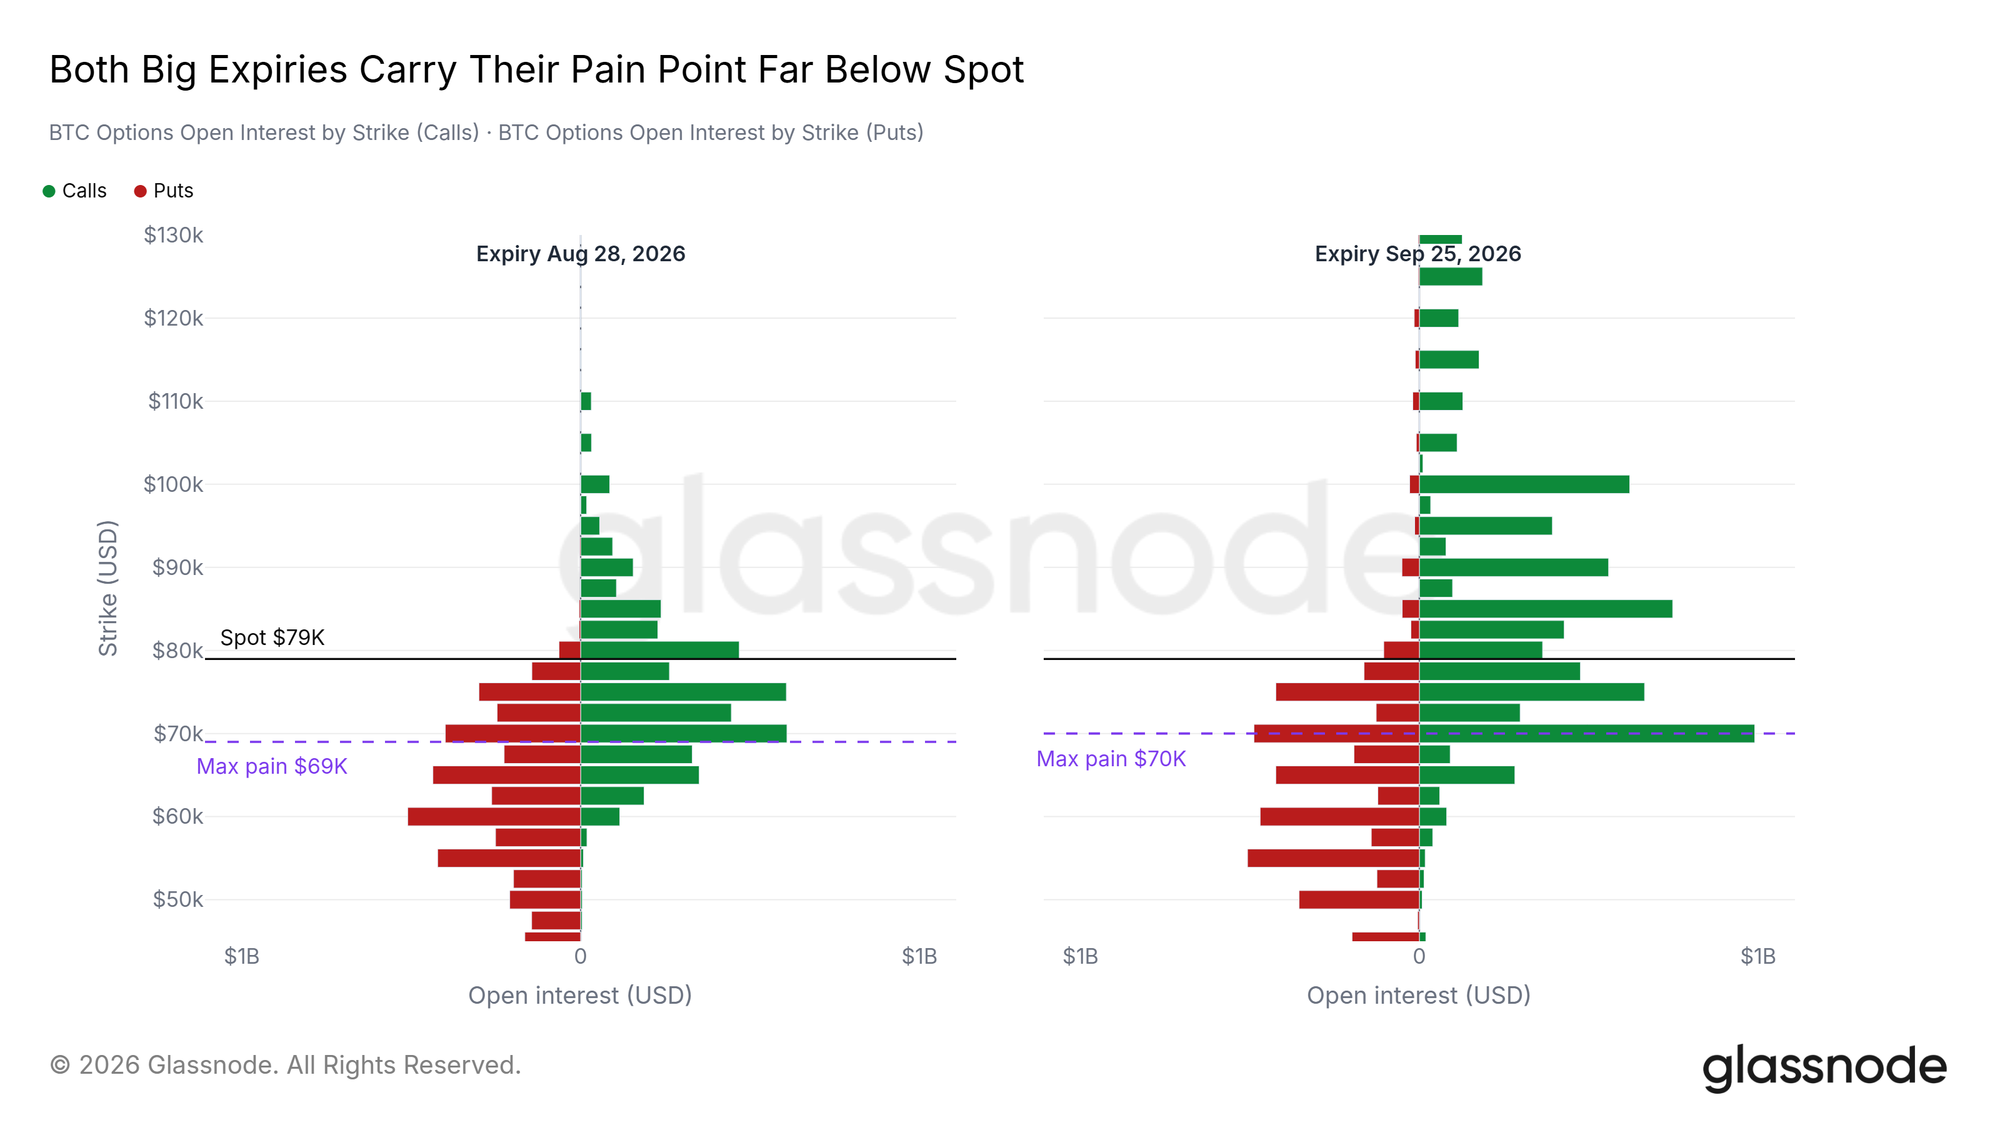
The options market shows patient expectations. The two most concentrated expirations in the next month—about $10.4 billion notional expiring this Friday and about $13.7 billion in the September quarterly expiration—both have max pain points far below the spot price. The max pain points (strike prices where the largest proportion of options expire worthless) are at $69,000 and $70,000 respectively, while spot is about $79,000. Below are dense put option areas, and above are call option order areas.
The forward distribution tends to flatten. As of the September 25, 2026 expiration, about 70% of strike price implied outcomes fall within the $69,000–$89,700 range, with the median only a few hundred dollars above spot. The base case priced by the options market is oscillation and stability within the current supply wall: neither expecting a breakout above the $86,000 area nor a return to the lower floor.
Conclusion
The largest short liquidation since our data source began initiated this rebound; sustained ETF subscriptions, active on-chain buying, and exchange net outflows provide the capital needed for continuation; cycle indicators still show the market is in an early stage. This is a typical picture of a staged rebound.
Confirmation signals come from above: an effective close above $83,300, with sustained ETF inflows, would indicate that the supply wall is being absorbed rather than respected. Weakness signals would first appear in the loss of the $70,000 short-term holder cost basis, followed by the $62,000–$65,000 floor defended by recent buyers. If the price returns to the squeeze starting point of $62,900, the entire move will be fully retraced.
This content is for informational and educational purposes only and does not constitute investment advice related to BTCC. BTCC makes every effort but cannot guarantee the truthfulness, accuracy, or originality of the content above.