Ethereum’s $3,000 Test Starts With the Weekly Close
 cryptonews
Ethereum is back near the level where a technical rebound becomes a broader trend test.
ETH is trading around $2,450 to $2,460 after bouncing roughly 34% from support near $1,900. The token reached a weekly high of $2,545.88 on Aug. 21 before settling into a tighter range between $2,400 and $2,500.
The move has changed the short-term chart. For much of August, ETH was capped below $1,950. It then broke through the $2,000 psychological level, reclaimed the $2,400 to $2,450 zone, and pushed toward the main resistance band between $2,500 and $2,550.
That zone now decides whether the rally can extend toward $3,000 or turns into another failed breakout.
The Breakout Level Is Clear
Market analyst Donald Dean noted that Ethereum has broken above a descending trendline that had capped previous price action. The $2,400 to $2,450 area, which had acted as resistance, is now trying to become support.
That flip is important. If ETH holds above that range into the weekly close, the market keeps a constructive higher-timeframe structure. If it loses the zone, the recent move starts to look more like a liquidity sweep than a clean trend reversal.
On the 4-hour chart, ETH is forming a bull flag after its sharp move from $1,900. The pattern would need a break above roughly $2,510 to $2,530 to confirm. A successful move through that band would put the Aug. 21 high at $2,545.88 back in play.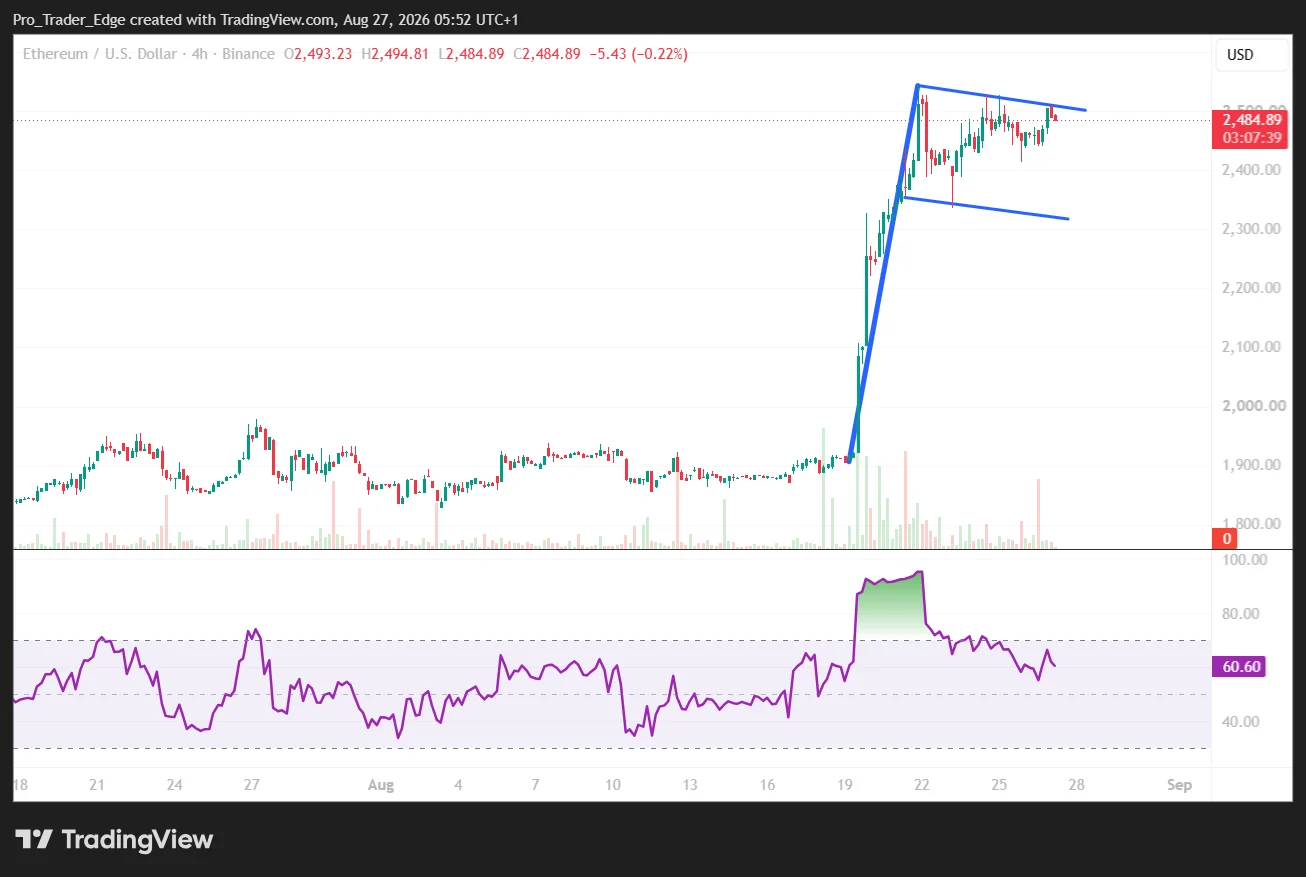
The next test is slightly higher. Market commentator Ted Pillows said ETH needs a weekly candle close above $2,550 to open a realistic path toward $3,000. That level is the main obstacle between the current consolidation and the next leg higher.
Whale Supply Is Waiting at $2,550 and $2,600
The resistance is not only technical.
Onchain order book data shows large whale sell orders clustered around $2,550 and $2,600. That creates a supply wall just above current prices.
At the same time, buy-side liquidity has built around $2,400. That makes the $2,400 area the key support zone for the current structure.
CoinGlass liquidation data adds another layer. The densest short liquidation cluster sits around $2,530 to $2,560. If ETH pushes into that area, forced short covering could add momentum and help price challenge the $2,600 supply wall.
That setup cuts both ways. A breakout through $2,550 could move quickly because of short liquidations. But if buyers fail to absorb whale supply, ETH could reject from the same zone and rotate back toward $2,400.
The Pullback Zone Sits Between $2,300 and $2,400
Analyst Michael van de Poppe has pointed to the $2,300 to $2,400 area as a potential accumulation zone if ETH pulls back.
That zone lines up with the broader demand area created by the breakout from former resistance. It also gives the market room to cool without immediately damaging the bullish structure.
Trader Daan Crypto Trades also noted that ETH is holding above former resistance, but warned that bulls still need to push price to fresh local highs. If they fail, the move above resistance could become a liquidity grab, with price slipping back below the reclaimed zone.
That is the short-term risk. ETH has reclaimed important levels, but it has not yet proved it can hold them while making a higher high.
The Weekly Chart Points to $2,823 First
The higher-timeframe chart has improved.
Ethereum has recovered the $2,300 to $2,400 region after rebounding from deeper support near $1,500 to $1,600. Analysts from Rand Group described that reclaim as a meaningful higher-timeframe development.
A confirmed weekly close above $2,400 keeps the path open toward $2,800 and potentially $3,400. The next clean technical objective above current levels is $2,823.
Crypto Tony’s chart suggests ETH may first retest the $2,420 area before attempting another push toward $2,630 to $2,650. Holding $2,420 would keep the bullish structure intact and preserve the chance of another move into resistance.
The sequence matters: hold $2,400, reclaim $2,550, clear $2,600, then test $2,823. The $3,000 level only becomes realistic if ETH gets through those steps without losing support

Momentum Is Strong, but Overheated
The rally has also pushed ETH into overbought territory.
The daily RSI is at 75.59, above the conventional overbought threshold of 70. That does not automatically mean the rally is over, but it does mean the market is stretched in the short term.
The Supertrend indicator places broader support near $2,158, about 14% below current prices. That level is far enough away that ETH could suffer a sharp pullback without fully breaking its higher-timeframe recovery.
For now, the nearer levels matter more. The market is watching $2,400 as support and $2,550 as the breakout trigger.
If ETH closes the week above $2,400 to $2,450, the rebound from $1,900 remains intact. If it closes above $2,550, the chart begins to point toward $2,823 and then the $3,000 area.
If it fails there, the rally may need to reset before the next attempt.
This content is for informational and educational purposes only and does not constitute investment advice related to BTCC. BTCC makes every effort but cannot guarantee the truthfulness, accuracy, or originality of the content above.