Bitcoin’s August Rally Was Built on Treasury Buybacks, Not Just Crypto Headlines
 cryptonews
Bitcoin’s strongest August since 2017 was not built on hype alone.
The trigger came from the U.S. Treasury market.
On Aug. 19, Treasury Secretary Scott Bessent announced that long-end bond buyback operations in the 10-year to 20-year and 20-year to 30-year sectors would double in maximum size, from $2 billion to $4 billion per operation. The new parameters are scheduled to run from Sept. 9 through Nov. 4, 2026.
Within 72 hours, crypto shorts were hit by a liquidation wave. Bitcoin moved from $64,100 to $69,500 in less than 12 hours, then continued to $81,240 by Aug. 24, its highest level since May 2026. Across major exchanges, short liquidations reached about $3.5 billion between Aug. 19 and Aug. 22, including $1.29 billion closed within a single hour.
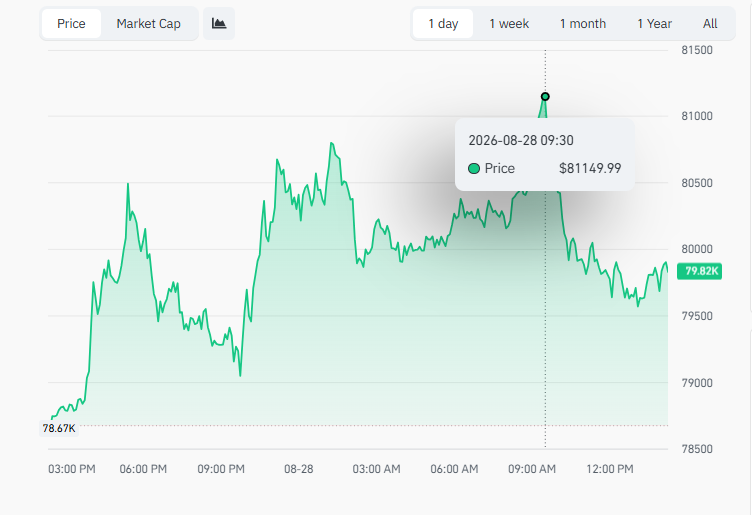
The headlines focused on crypto policy meetings, SEC proposals and renewed risk appetite. Those factors helped. But the real transmission came from macro plumbing: Treasury buybacks compressed long-term yields, loosened financial conditions, weakened the dollar and forced a heavily short crypto derivatives market to cover.
What the Treasury Changed
Treasury buybacks are not new. The program was reintroduced in 2024 after a two-decade pause, mainly to improve liquidity in older off-the-run Treasury securities.
The mechanism is straightforward. The Treasury repurchases older, less liquid bonds from dealers and replaces them with newer issuance. Total debt outstanding does not meaningfully change, but market functioning improves because dealers hold fewer illiquid securities.
The Aug. 19 announcement mattered because it targeted the long end of the curve. The 30-year Treasury yield had reached 5.34% on Aug. 18, its highest level in 19 years. By doubling the maximum size of buybacks in longer maturities, the Treasury signaled that it was willing to absorb more long-duration supply.
That signal was enough to move markets before the larger operations even began.
Why Yields Mattered for Bitcoin
When the Treasury buys long-dated bonds, it removes supply from the market. Lower supply supports bond prices. Higher bond prices push yields lower.
After the announcement, the 30-year yield fell from 5.34% to 5.19%, a 15 basis point drop from the weekly peak. For long-duration bonds, that is a large move. In a market measured in trillions of dollars, it represents a meaningful shift in financial conditions.
Lower long-term yields matter for risk assets because they reduce the discount rate applied to future cash flows, ease borrowing costs and weaken the appeal of holding cash-like dollar assets. The dollar index also softened after the announcement as the yield advantage of U.S. bonds narrowed.
Bitcoin tends to respond strongly to that mix. It does not generate yield, so its relative appeal improves when real yields and the dollar fall. The move also arrived after months of weak sentiment, making positioning especially vulnerable.
The Derivatives Market Was Loaded With Shorts
The macro catalyst hit a crypto derivatives market that had spent weeks leaning bearish.
Bitcoin perpetual futures open interest had risen 34% since July 1 as traders bet that the range-bound market would continue. Funding rates across major exchanges were negative, meaning shorts were being paid to keep their positions open.
That setup can persist for a while. It ends when an outside catalyst forces price through the levels where leverage becomes unstable.
The Treasury announcement became that catalyst. Bitcoin’s 8.2% intraday surge on Aug. 19 overwhelmed short sellers’ margin buffers. As exchanges liquidated short positions, forced buying pushed the price higher, which triggered the next layer of liquidations.
The feedback loop was mechanical: price rose, shorts closed, forced buying lifted price further, and more shorts were closed.
By Aug. 20, Bitcoin had broken above $71,000. By Aug. 24, ETF inflows and spot buying helped carry it through $80,000.
ETF Inflows Supplied the Follow-Through
The short squeeze created the first burst of momentum. Spot Bitcoin ETFs supplied the second.
U.S. spot Bitcoin ETFs drew $1.92 billion in net inflows during the week of Aug. 17 to Aug. 21, their strongest week in nearly 10 months. Single-day inflows peaked at $606.3 million on Aug. 20, one day after the Treasury announcement.
That matters because ETF flows are different from liquidation flows. A short liquidation closes an existing position. An ETF inflow creates direct spot demand because authorized participants must source Bitcoin to back new shares.
By Aug. 24, August ETF inflows had reached $2.72 billion, making it the strongest inflow month of 2026 with a full trading week still left. ETF assets under management approached $100 billion for the first time.
That is why the rally did not stop when the liquidation cascade faded. Forced buying pushed Bitcoin out of the range. ETF demand helped hold the new price level.
Sentiment Flipped Faster Than Positioning
The Crypto Fear and Greed Index shows how quickly the market psychology changed.
On Aug. 12, the index stood at 27, deep in fear territory. That was consistent with the first seven months of 2026, when the index averaged just 24.2 amid range-bound trading and regulatory uncertainty.

By Aug. 22, the index had jumped to 74, its highest reading since early October 2025. A 47-point swing in 10 days is rare, even in crypto.
That reversal reflects more than optimism. It reflects forced repositioning. When a heavily short market squeezes higher, traders who were bearish are forced to capitulate. That can make sentiment indicators look much healthier very quickly.
The risk is that fast sentiment reversals can also mark short-term exhaustion. In October 2025, a similar move in the Fear and Greed Index preceded a 22% Bitcoin drawdown over the following six weeks.
The difference this time depends on whether the macro tailwind continues after the larger Treasury buybacks begin on Sept. 9.
Why the Short Squeeze Cannot Repeat Immediately
The $3.5 billion liquidation wave was powerful, but it was also a one-time event.
The short positions liquidated between Aug. 19 and Aug. 22 cannot be liquidated again. Open interest has contracted. Funding rates have flipped positive, meaning longs are now paying shorts to maintain positions. The leverage that powered the first move has already been cleared.
That changes the next phase of the market.
A move from $64,000 to $80,000 could be driven by forced short covering. A move from $80,000 to higher levels needs fresh spot demand, sustained ETF inflows or another macro catalyst.
ETF demand exists, but the recent pace is unusually strong. In 2026, weekly inflows of $1.92 billion have not been sustained for long. If flows normalize back toward the $500 million to $800 million range, the buying pressure behind $80,000 weakens.
Positive funding also creates a headwind. When longs pay to hold exposure, crowded bullish positioning becomes more expensive over time.
Altcoins Followed Bitcoin, but Not on Their Own Terms
The rally spread across the crypto market. Ethereum rose from $1,900 to $2,450. Solana climbed from $145 to $192. PEPE gained 21%, while FLOKI rose 30%. Altcoin market capitalization jumped 24% in three days.
That led some traders to call the start of alt season. The data is less convincing.
Most of the move looked like high-beta exposure to Bitcoin. Ethereum’s correlation with Bitcoin over the five-day rally window reached 0.96, close enough to suggest that the market was trading the same macro signal across different assets.
That distinction matters. When altcoins rise because of their own catalysts, the market has multiple sources of support. When they rise because Bitcoin rises, the entire market depends on the same driver.
If the Treasury buyback thesis weakens, the same correlation that lifted altcoins can pull them down together.
Why This August Stands Out
Bitcoin’s August 2026 gain is tracking above 25%, making it the second-best August on record behind August 2017, when Bitcoin rose 65%.
The comparison is tempting but imperfect.
In 2017, the rally was driven by retail speculation, initial coin offering mania and a still-young crypto market. There were no U.S. spot Bitcoin ETFs, no mature institutional derivatives market and no deep macro linkage to Treasury yields.
The 2026 rally is different. It is institutional, macro-sensitive and derivatives-driven. ETF flows, yield compression and liquidation mechanics did more work than retail enthusiasm.
That makes the rally more traceable, but not necessarily safer.
September has historically been a weak month for Bitcoin, with an average return near negative 4.5% since 2013. If the Treasury buybacks begin as expected and the Federal Reserve sounds more open to easing, the seasonal pattern could break. If either disappoints, seasonality and post-squeeze positioning become a real risk.
The Next Catalyst Matters More Than the Last One
The rally’s cause is clear. Treasury buyback expectations pushed down long-end yields, triggered a short squeeze and drew ETF inflows back into Bitcoin.
The question is what comes next.
The bull case is that the larger buyback operations beginning Sept. 9 reinforce the move in yields, while the Fed’s policy path turns more supportive into Q4. If that happens, Bitcoin could hold above $80,000 and build a base for another leg higher.
The bear case is that the market has already priced the liquidity signal, the liquidation fuel is gone, and ETF inflows cool after the initial surge. In that scenario, Bitcoin could drift lower as leverage rebuilds and traders wait for a new catalyst.
The August rally was not random. It was mechanical, traceable and rooted in the bond market.
But the same mechanism will not repeat in the same way. The next move, whether higher or lower, will need fresh fuel.
This content is for informational and educational purposes only and does not constitute investment advice related to BTCC. BTCC makes every effort but cannot guarantee the truthfulness, accuracy, or originality of the content above.