Bitcoin Holds $80,000 Level: How Do Institutions and Smart Money View the Outlook?

Original author: ChandlerZ, Foresight News
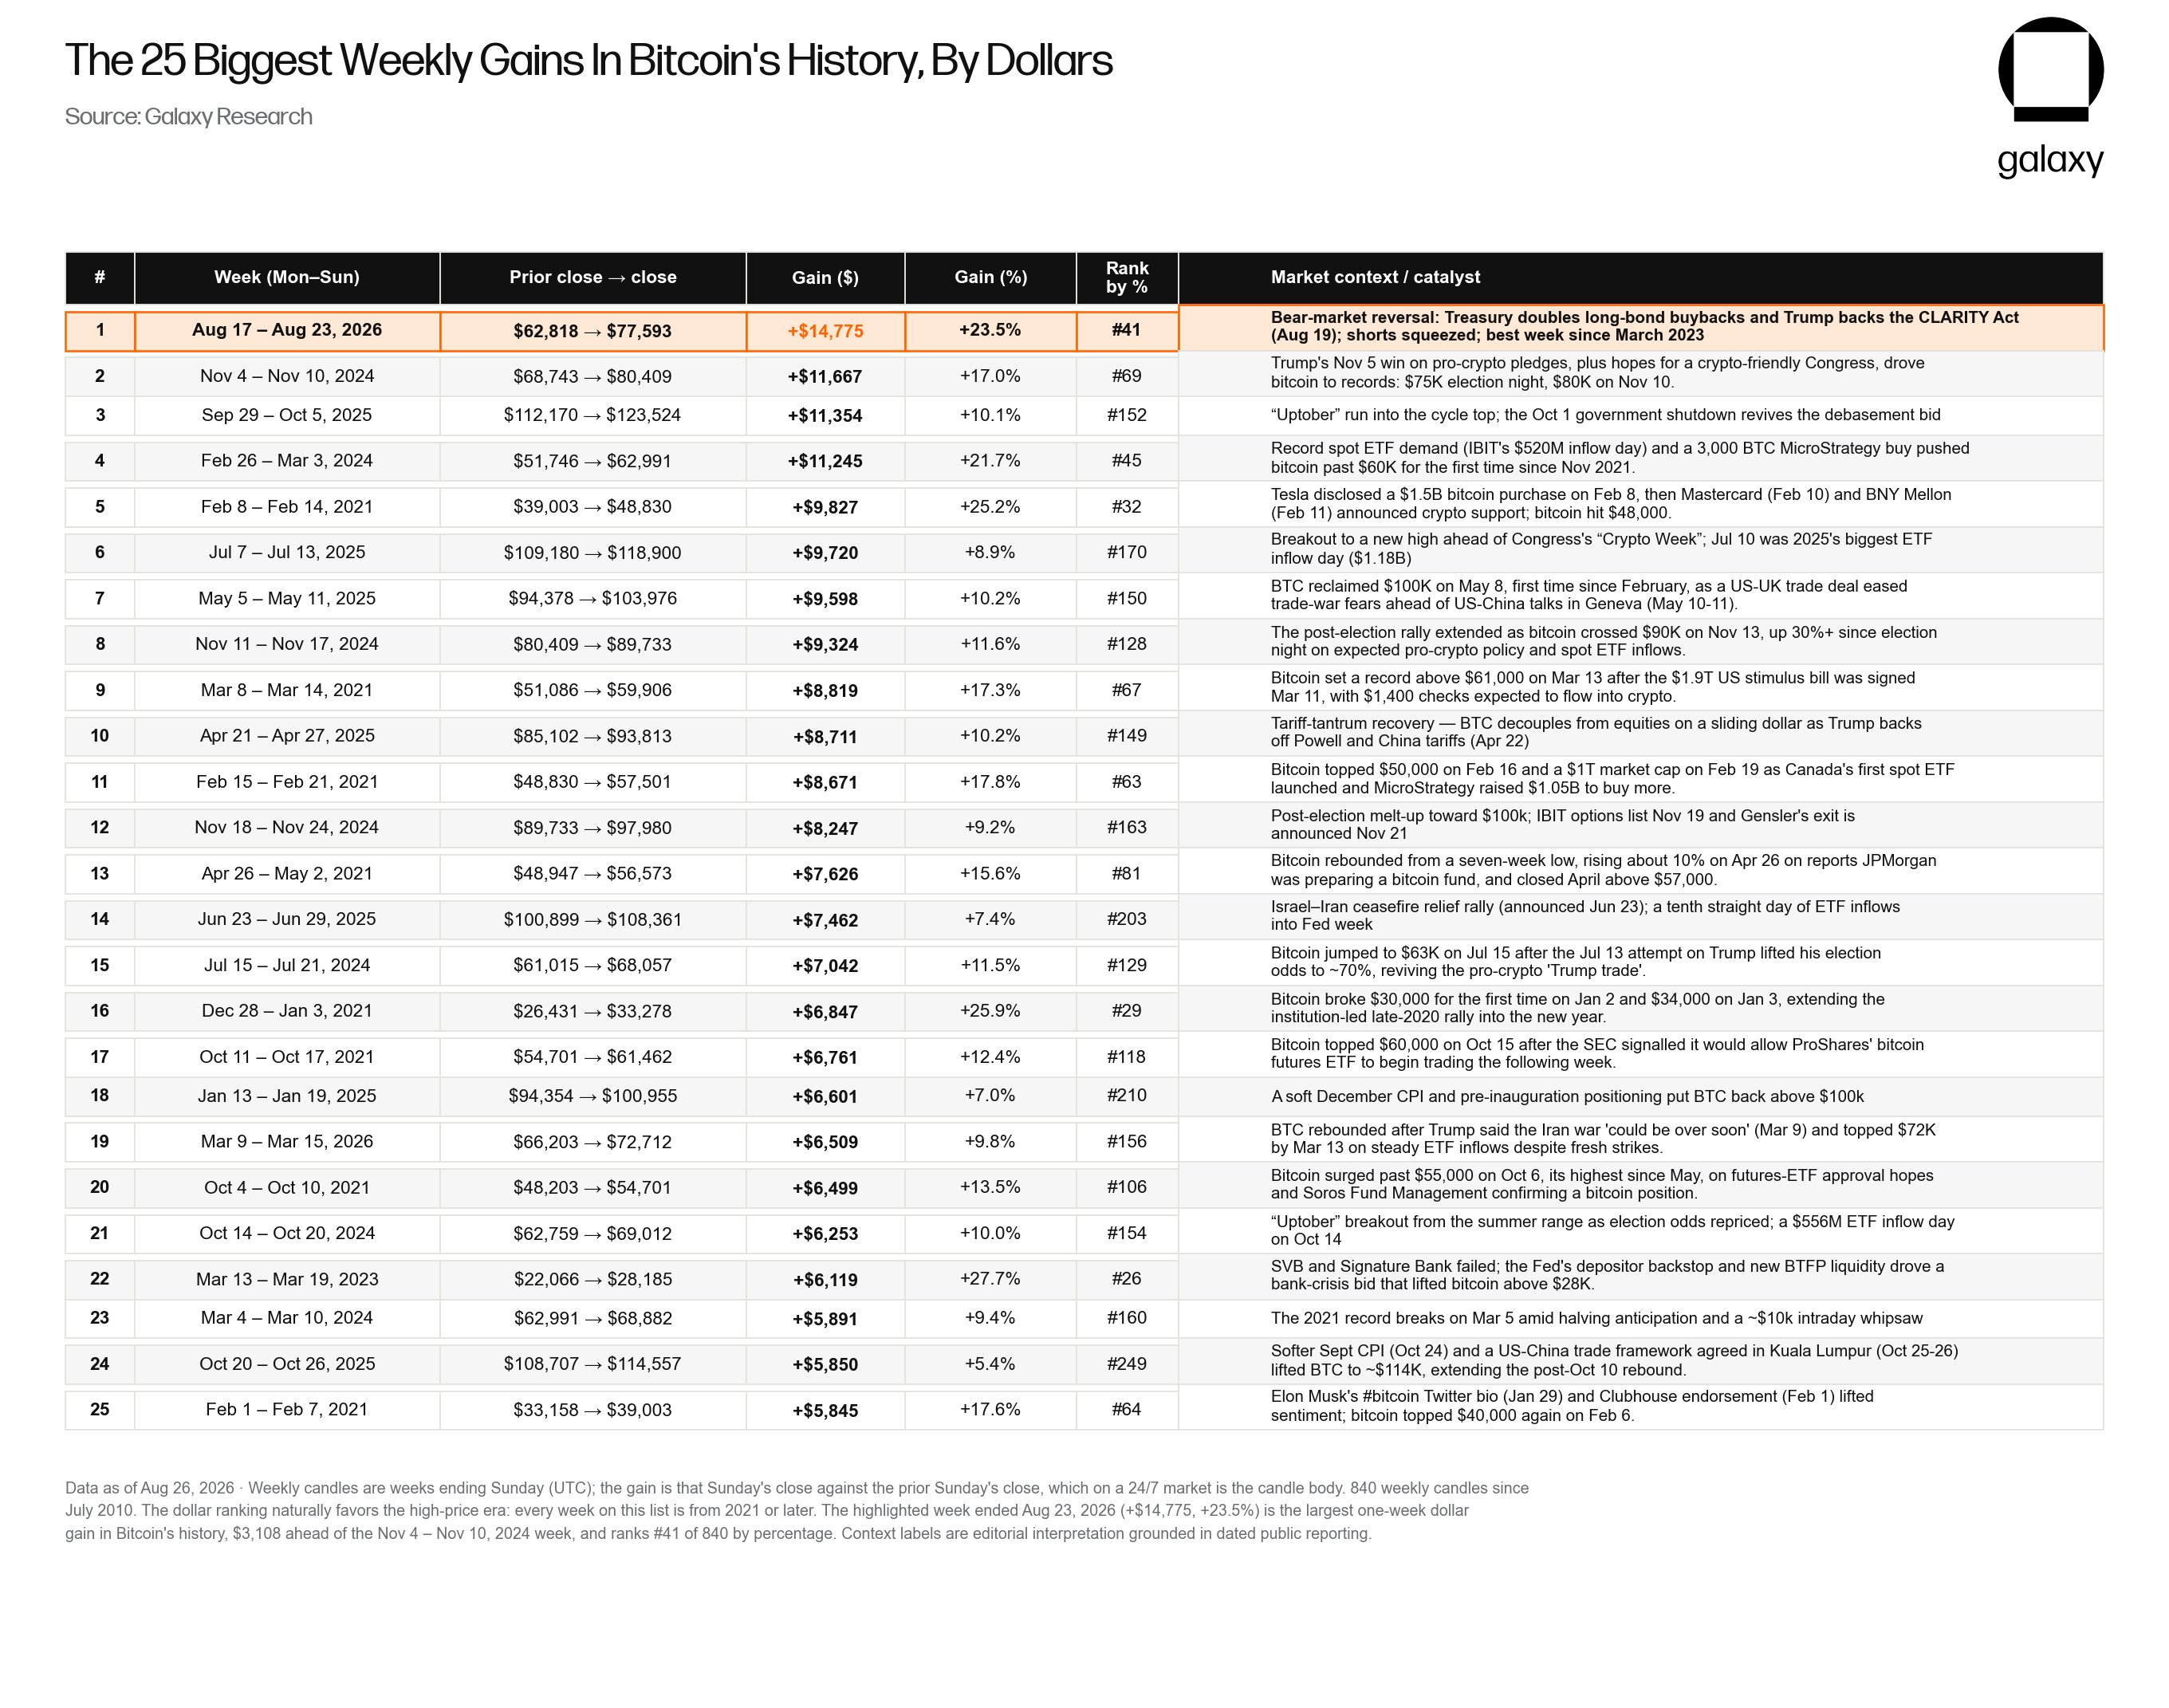
From August 17 to 23, Bitcoin rose from $62,818 to $77,593. According to Galaxy Research, this weekly candle added $14,775, marking the largest single-week dollar gain in Bitcoin's history. In percentage terms, the 23.5% increase ranks only 41st among 840 weekly candles since July 2010, but it is the highest since March 2023.
As Bitcoin's price base has risen, a gain that ranks only 41st historically has been able to create a dollar amount never seen before.
As of August 28, Bitcoin turned downward after breaking above $81,500 and is still battling around the $80,000 level. U.S. spot Bitcoin ETFs have become a key variable in determining whether this rally can continue. According to Farside Investors' daily totals, from August 17 to 26, there were eight consecutive trading days of net inflows totaling $2.8019 billion, and cumulative net inflows for August through the 26th were approximately $3.282 billion.
Glassnode divides this rally into two phases: short liquidations on August 19 initiated the upward move, and subsequent ETF subscriptions, declining exchange balances, and accumulation across wallets of all sizes provided spot funding. From August 14 to 25, BTC-denominated futures open interest fell from 645,760 BTC to 587,584 BTC, a decrease of about 9.0%, hitting a near five-month low. During the same period, open interest using BTC and other crypto assets as margin dropped to about 52,000 BTC, accounting for 11% of futures open interest, with cash and stablecoin margin now dominating.
Additionally, perpetual funding rates have been near neutral most of the time, indicating that the liquidated shorts were not immediately replaced by a large amount of leveraged longs.
Based on existing evidence, this rally has genuine capital support, and $80,000 is still in a stress-test phase. Short-term debate centers on whether the supply zone between $81,000 and $86,000 can be absorbed, while medium-term debate centers on whether this move is a cyclical reversal or a rapid recovery within a bear market framework.
On-chain chips and order books point to $81,000–$86,000
On-chain data shows that the $80,000 level is forming one of the densest resistance areas in its history. According to Glassnode's entity-adjusted realized price distribution (URPD) data, nearly 8% of Bitcoin's circulating supply is concentrated in the $80,000 to $82,000 range, with about 5% of chips concentrated at the single $80,000 price level alone, the highest among all price levels. This means that once the price returns to this area, a large number of previously bought investors will return to their cost basis, potentially triggering concentrated selling and forming a so-called supply wall.
$78,000 is also an important node, holding about 3.7% of supply, while $82,000 ranks as the fourth largest concentration. These investors, who built positions during the 2024-2025 uptrend, are now waiting for a chance to break even after experiencing price corrections from late 2025 to early 2026. Historical experience shows that when price returns to a range with heavy chip turnover, selling by short-term holders tends to amplify resistance.
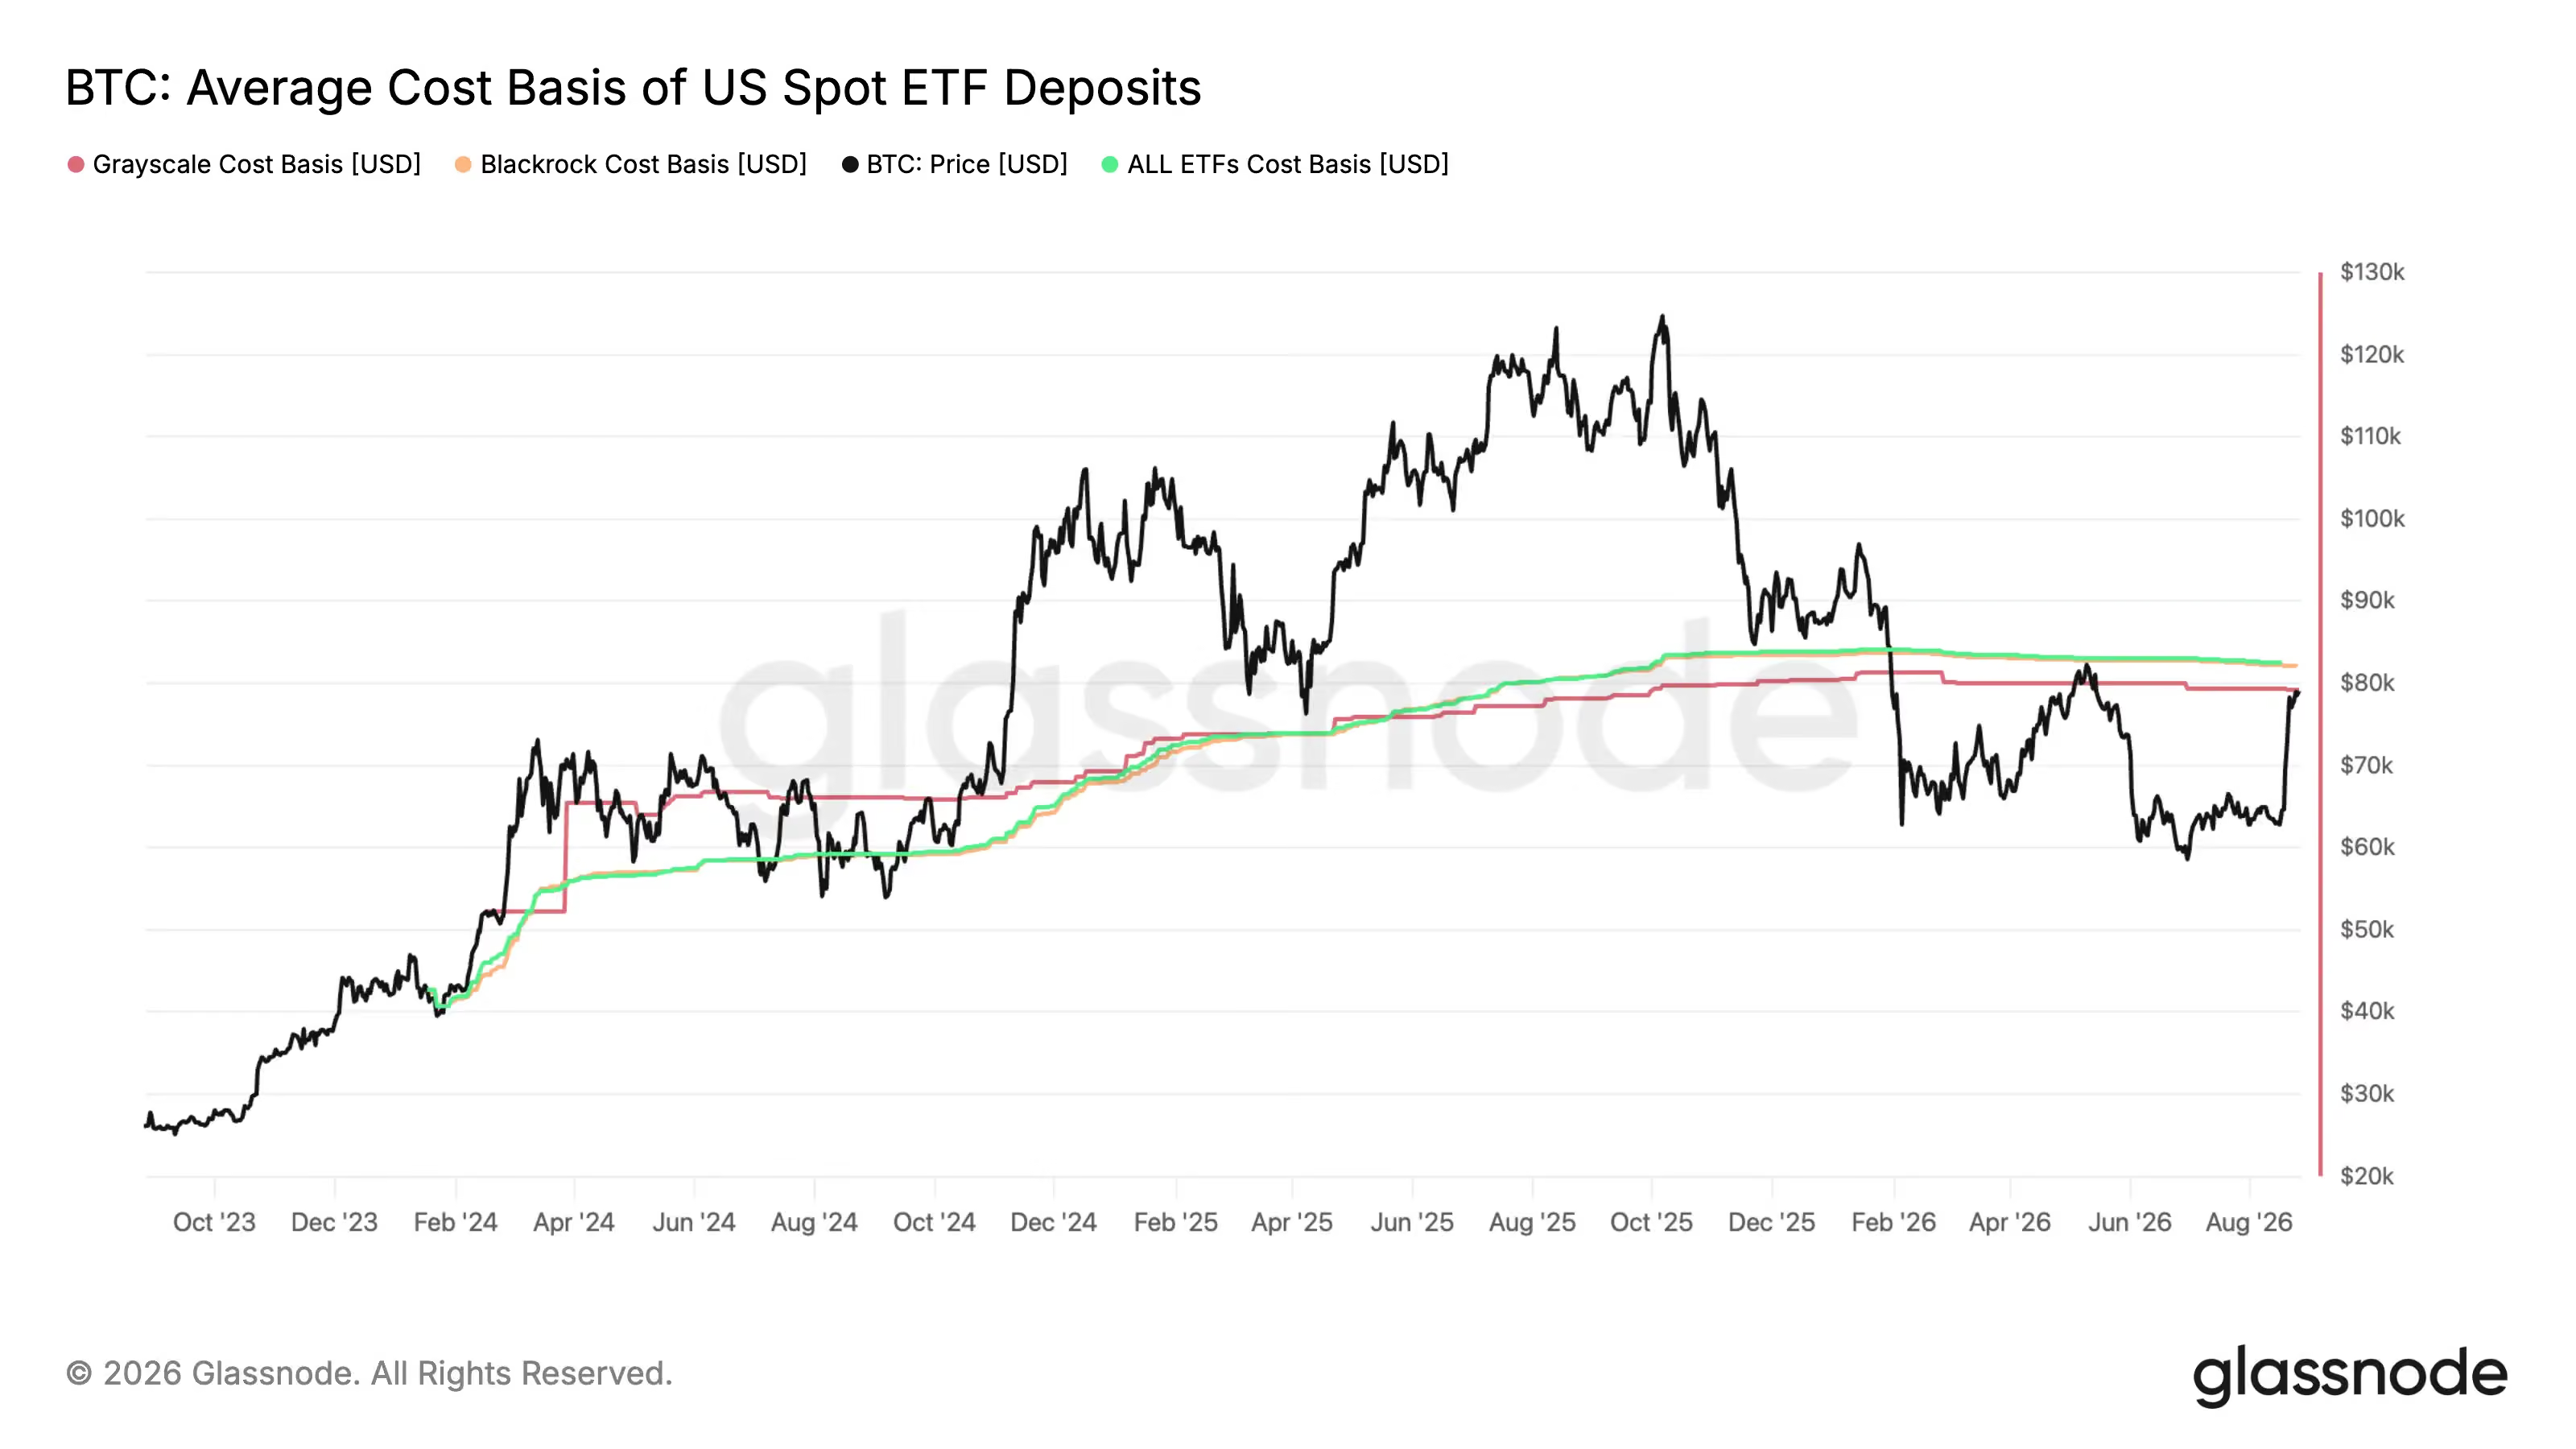
Indicators tracked separately by Glassnode show that the average cost basis of U.S. spot Bitcoin ETF holdings also falls in the $80,000 to $82,000 range. Since ETFs are one of the most important sources of incremental capital in the current market, the behavior of their holders has a significant impact on price. When the price approaches this "breakeven line," some institutional or retail investors may choose to redeem or sell, further strengthening selling pressure in this area.
From a technical perspective, Bitcoin is still below the 50-week moving average (currently around $81,081), and has failed to effectively reclaim this average since November 2025. Historically, in May 2020 and March 2023, Bitcoin started multi-month bull markets after breaking above this long-term trend line. Therefore, whether it can hold above $81,000 is seen as a key signal of medium-term strength or weakness.
However, in the $60,000 to $63,000 range, more than 6% of supply is also concentrated. But that area successfully turned into strong support for most of 2026.
The firm believes that Bitcoin is currently at a critical juncture of bull-bear battle. If bulls can effectively break through the "triple resistance zone" of $80,000 to $82,000 with incremental capital and hold above the 50-week moving average, it may open up room to move higher, repeating the historical bull market script after breaking above long-term averages. Conversely, if multiple attempts fail, it may trigger panic selling by short-term holders, causing the price to fall back to $75,000 or even lower support levels to find balance.
Latest views from institutions and smart money
CryptoQuant Research:
September has long been one of the weakest months for U.S. stocks, with the S&P 500 averaging about -0.8% over the past 50 years. Bitcoin recorded negative returns in September for six consecutive years from 2017 to 2022, but posted gains in September 2023, 2024, and 2025, indicating that this seasonal pattern is weakening.
In 2026, uncertainty surrounding the U.S. midterm elections may increase volatility and prompt investors to reduce risk exposure. The core question is whether seasonal adjustments will evolve into broad risk aversion, and attention should be paid to ETF flows and spot BTC demand. If risk-off sentiment spreads across the market, Bitcoin will face pressure; conversely, if ETF and spot demand remain strong, the traditional September pattern may be broken again.
K33 Research:
BTC reclaimed the 50-day, 100-day, 200-day, and 200-week moving averages within four days. K33 views January and October 2023 as the closest historical analogs, believing that record short squeezes, recovery in trading activity, and rotation into scarce assets resemble the early stages of past cyclical bull markets.
CoinShares:
The cycle low may have already occurred, and the next two to three months are more likely to see range-bound trading. BTC may approach $80,000, but it will be difficult to sustain above that level; a more durable push toward $100,000 would require further weakening in employment data and a significant downward revision in market rate expectations.
Bitwise Europe:
Bitcoin's bottoming process has entered a late stage. Sustained trading above the short-term holder cost basis of $69,000 will improve the local market structure; with simultaneous improvement in capital flows and market participation, breaking and holding above the true market mean of $76,000 will confirm a return of macro risk appetite and mark the end of the bear market.
Trader "Set 10 big goals first":
Already bought back two-thirds of the position in the $78,000–$79,800 range. Basically, before $100,000, it's hard to see a decent pullback. $100,000 is coming soon.
MN Capital Founder and CIO: Michaël van de Poppe:
The uptrend may last longer than expected, and we will see Bitcoin push to at least $82,700, possibly even $90,000. Bitcoin is currently in a fairly good consolidation range. Of course, the market is ever-changing, but given the current upward momentum, retesting the highs seems inevitable. Any price below $74,000 is an excellent entry opportunity.
This content is for informational and educational purposes only and does not constitute investment advice related to BTCC. BTCC makes every effort but cannot guarantee the truthfulness, accuracy, or originality of the content above.