From Panic to Greed: Can BTC Hold the 52-Week Moving Average? | Special Analysis
 Odaily
This week, the BTC sentiment index has jumped from "extreme fear" to "extreme greed," but the price has not yet firmly held the 52-week moving average (around $81,700). Neither of the two criteria for the pullback confirmation mechanism has been met—this is an oversold bounce, and it is too early to declare a bull market. From the perspective of Chanlun, the daily terminal point 5 is in the final stage of leaving central pivot A, and we are closely watching the timing of the construction of the second upward central pivot B. HYPE has also entered the construction period of central pivot B, and in the short term, we are watching for stabilizing signals in the $73–$77 support area.
I. Assessment of Bitcoin's Current Market Nature
1. Market sentiment index: switching from "extreme fear" to “extreme greed”
From the sentiment index above, it can be seen that after nearly two months of rebound, especially the accelerated upward movement in the past two weeks, BTC's market sentiment has undergone a fundamental reversal. The market's perception of the nature of this rebound has changed, with more and more views leaning toward a "bull market return" judgment. Below, we will sort out our core judgment on the current market stage from a technical perspective.
2. Historical data retracement and the 52-week moving average confirmation mechanism
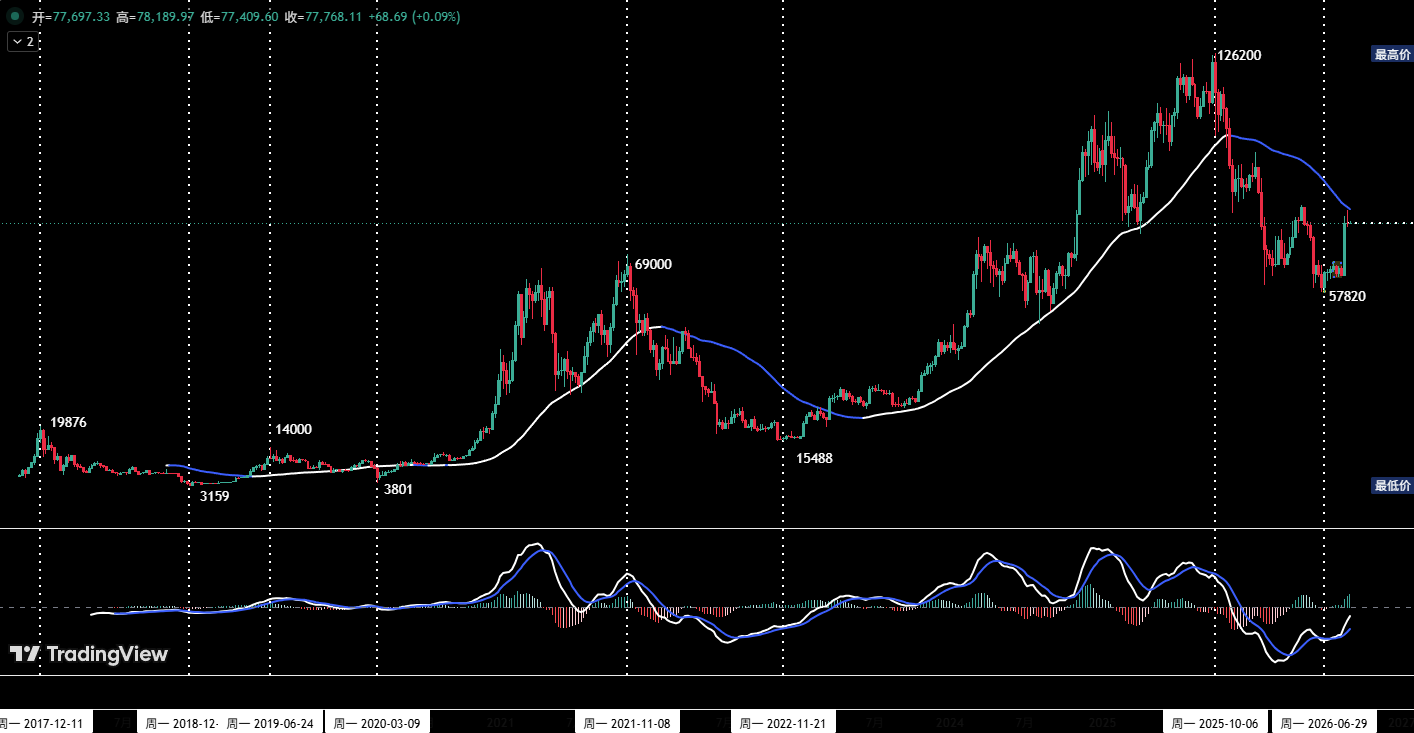
Figure 1: Bitcoin Weekly K-line Chart
Based on the weekly framework, we conducted a retrospective analysis of historical data over the past nine years and found that whenever a significant trend reversal occurs (i.e., a bull-bear cycle transition), it can be confirmed using a quantitative indicator, namely the 52-week moving average. This moving average has strong noise-filtering ability for medium- and long-term trends and serves as the watershed for distinguishing bull and bear markets. To improve the practicality of this indicator, we break it down into two dimensions of quantitative confirmation criteria:
① Position status (trend direction determination)
• Bull market environment: price consistently runs above the 52-week moving average, and the moving average slope turns upward;
• Bear market environment: price consistently runs below the 52-week moving average, and the moving average slope diverges downward;
• Overextension/oscillation: price repeatedly crosses the moving average, and the moving average flattens (the absolute value of the slope converges within a threshold).
② Breakout/breakdown confirmation period (filtering false signals)
• Effective breakout (bear to bull): weekly closing price holds above the moving average for 2–3 consecutive weeks; a single-week spike followed by a pullback is considered a false breakout and is not confirmed;
• Effective breakdown (bull to bear): weekly closing price closes below the moving average for 2 consecutive weeks; a single-week wick is not confirmed.
3. Current market attribute judgment
According to the above quantitative criteria for bull-bear transition: the current price has approached the 52-week moving average (around $81,700) but has not effectively broken through, and the moving average is still in a downward phase. Against the confirmation mechanism, a bull market requires the price to hold above the moving average for two consecutive weeks and the slope to turn upward; currently, neither condition is met. Therefore, we believe that the current BTC market is still an oversold bounce, and it is too early to declare a bull market. The market is in a transition and confirmation period.
II. Analysis of Bitcoin's Daily-Level Trend Structure
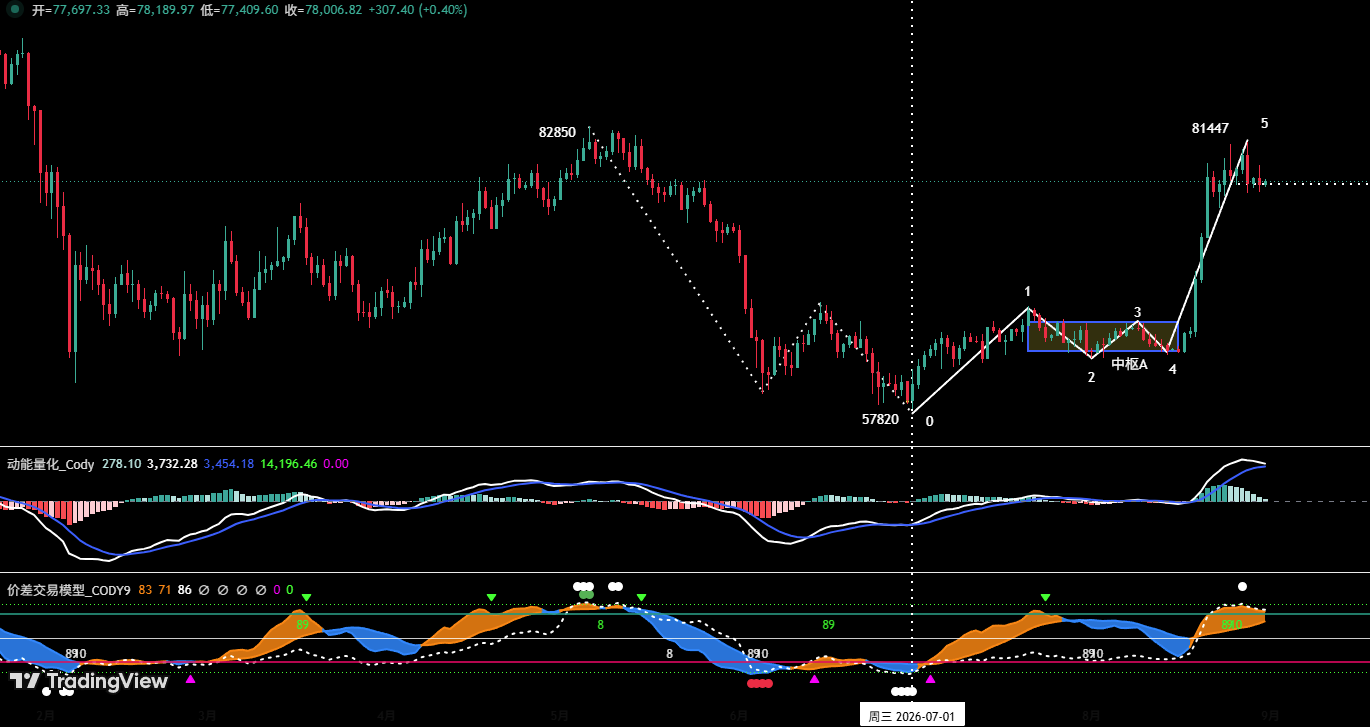
Figure 2: Bitcoin Daily K-line Chart
In the previous weekly review of this column, we used Elliott Wave theory to systematically analyze and position the rebound structure that started from the July 1 low of $57,820. This issue introduces the Chanlun analysis framework to provide a multi-dimensional restatement and cross-validation of the same rebound. We aim to deepen readers' understanding of the evolution path and trend nature of the current market structure through mutual corroboration and cross-checking of different technical systems, thereby building a more three-dimensional and objective market cognition framework to assist subsequent analysis.
1. As shown in (Figure 2): the rebound starting from the July 1 low of $57,820 has clearly presented a five-wave rebound structure from (0-1) to (4-5) on the daily level; among them, the three waves (1-2), (2-3), and (3-4) overlap, forming the first upward central pivot (central pivot A) of this rebound according to the rules; the current price is running in the departure segment (4-5) leaving central pivot A.
2. Momentum comparison for central pivot A: comparing the upward strength of the entry segment (0-1) and the departure segment (4-5), the departure segment's rebound strength is significantly greater than the entry segment, and there is no momentum divergence between the two. Based on this, after the (4-5) segment ends, the market is likely to enter a 2–3 week wide-range oscillation and construct the second upward central pivot (central pivot B). After completion, a departure segment leaving central pivot B will start, which is expected to temporarily hold above the 52-week moving average and further challenge the key resistance level of $82,850, setting a new rebound high. We will track and analyze at that time.
III. Bitcoin Weekly Forecast and Trading Strategy
1. BTC weekly trend forecast
Core view for this week: closely monitor the termination position of "terminal point 5" on the daily chart and the potential construction of the second upward central pivot.
2. Key resistance levels
• First resistance zone: $81,700–$82,850 area (previous important level)
• Second resistance zone: around $84,500 (previous important resistance area)
• Third resistance zone: $90,000 area (key round number)
3. Key support levels
• First support level: $73,500–$75,000 area (previous important support level)
• Second support level: $67,300–$69,100 area (previous important support level)
4. Weekly trading strategy (excluding impact of unexpected news)
① Medium-term strategy:
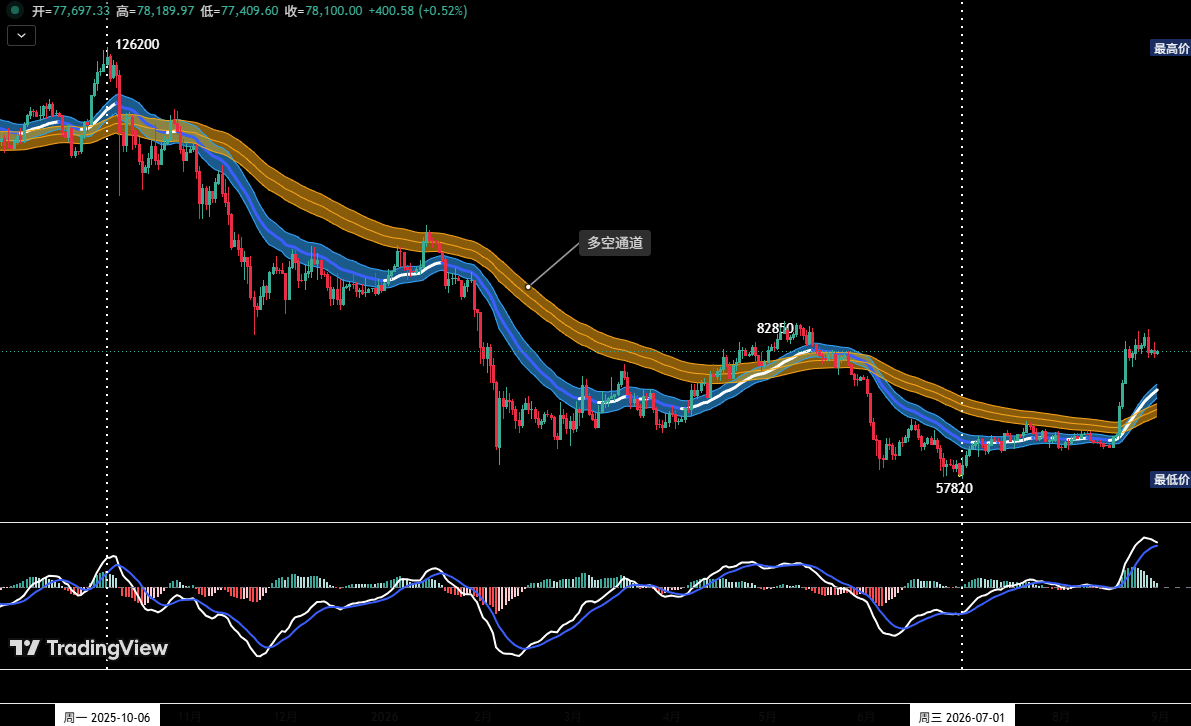
Figure 3: Bitcoin Daily K-line Chart: (Position Monitoring Model)
Position monitoring model: As shown in (Figure 3), the current price has effectively broken through the "long-short channel," and the market structure has changed in the short term. The current medium-term position is zero, and we remain in a wait-and-see state with no position.
② Short-term strategy: use 30% of the position, set stop-loss points, and look for "spread" opportunities based on support and resistance levels. (Use 30-minute/60-minute as the operating cycle).
③ In short-term operations, to dynamically adapt to the complex evolution of the market, we have pre-formulated the following operational plans.
• Light position trial long in strong support area.
• Entry: when the price pulls back to the above first or second important support level, a clear stabilization pattern appears, and the quantitative model simultaneously issues a bottom signal, a long position of about 30% can be established.
• Risk control: set an initial stop-loss level.
• Exit: when rebounding to near important resistance levels and combined with model signals, gradually clear positions to take profits.
IV. HYPE Trend Structure Analysis
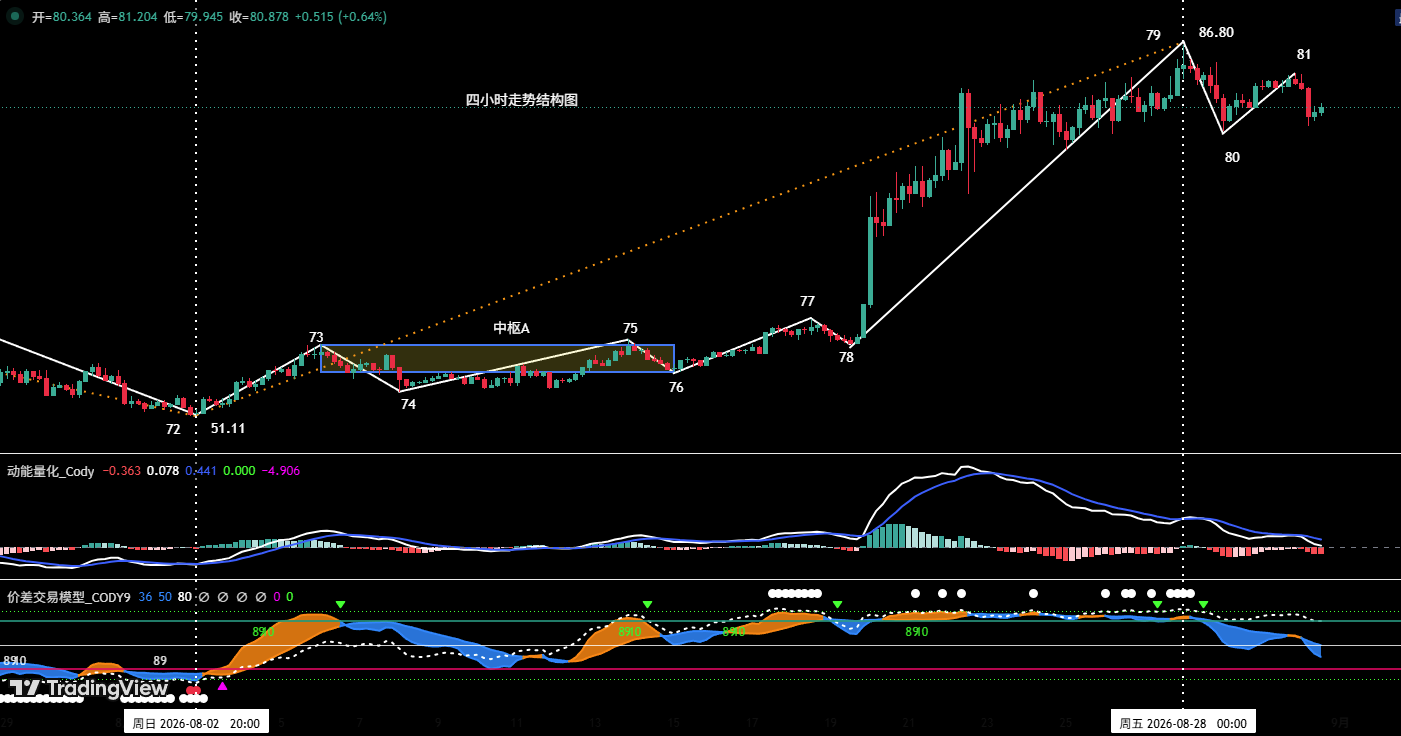
Figure 4: HYPE 4-hour K-line Chart
1. On the 4-hour framework: the upward move starting from the August 2 low of $51.11 has been clearly decomposed into a nine-wave upward structure from (72-73) to (80-81); among them, the three waves (73-74), (74-75), and (75-76) overlap and can form the first upward central pivot (central pivot A).
2. Upward momentum analysis for central pivot A: comparing the upward strength of the entry segment (72-73) and the departure segment (78-79), the departure segment's upward strength is significantly greater than the entry segment, and there is no momentum divergence between the two. Therefore, after the (78-79) segment ends, the currently running (79-80) and (80-81) are likely constructing the second upward central pivot (central pivot B). After central pivot B is completed, a departure segment leaving central pivot B will begin.
V. HYPE Weekly Forecast and Short-term Trading Strategy
1. HYPE weekly trend forecast
① Key resistance levels:
• First resistance level: around $87–$90
② Key support levels:
• First support level: around $77;
• Second support level: around $73;
Core view for this week: focus on the node when central pivot B is completed.
2. HYPE weekly short-term trading strategy
Short-term operations this week:
① For those holding long positions: if investors have established long positions in the $50–$52 area according to the previous trading plan, it is recommended to move the initial stop-loss up to around $70 to protect existing profits, strictly adhere to stop-loss discipline, and hold positions waiting for further gains.
② For those with no position: if the price pulls back to the key support area of $73–$77, stabilizes, and issues a clear buy signal, consider a light position trial long, with stop-loss set and strictly executed.
VI. Special Reminders
1. When opening a position: immediately set an initial stop-loss level.
2. When profit reaches 1%: move the stop-loss to the entry cost price (break-even point) to ensure principal safety.
3. When profit reaches 2%: move the stop-loss to the position of 1% profit.
4. Continuous tracking: thereafter, for every additional 1% profit in the price, move the stop-loss by 1% simultaneously to dynamically protect and lock in profits.
Financial markets are ever-changing, and all market analysis and trading strategies need to be dynamically adjusted. All views, analytical models, and operational strategies involved in this article are derived from personal technical analysis and are for personal trading logs only, not constituting any investment advice or operational basis. Markets are risky, and investment should be cautious. Please do not make decisions based on this.
This content is for informational and educational purposes only and does not constitute investment advice related to BTCC. BTCC makes every effort but cannot guarantee the truthfulness, accuracy, or originality of the content above.