ZEC Defies Black Friday Plunge: $300 Rebound Imminent Despite Market Carnage

Black Friday's crypto massacre couldn't keep Zcash down for long. The privacy-focused asset is already shaking off the bloodbath and positioning for a major recovery.
Resilience in the Face of Panic
While weaker coins crumbled, ZEC's core technology and loyal holder base created a foundation that even a Black Friday sell-off couldn't completely destroy. The bounce-back mechanics are already kicking in.
The $300 Target Lives
Market analysts who predicted ZEC's return to $300 aren't backing down. The fundamental case remains intact—privacy features that actually work and institutional interest that hasn't evaporated with one bad trading day.
Because nothing says 'sound investment' like watching your portfolio swing 40% while eating Thanksgiving leftovers. But hey, at least the transaction history stays private.
ZEC's proving that some digital assets have more staying power than your average Black Friday discount TV. The rebound isn't just possible—it's already in motion.
ZEC’s $300 Cluster Draws Traders In
According to data from Coinglass, ZEC’s liquidation heatmap shows a dense capital cluster slightly above its current price level at $300.56.
: Want more token insights like this? Sign up for Editor Harsh Notariya’s Daily crypto Newsletter here.
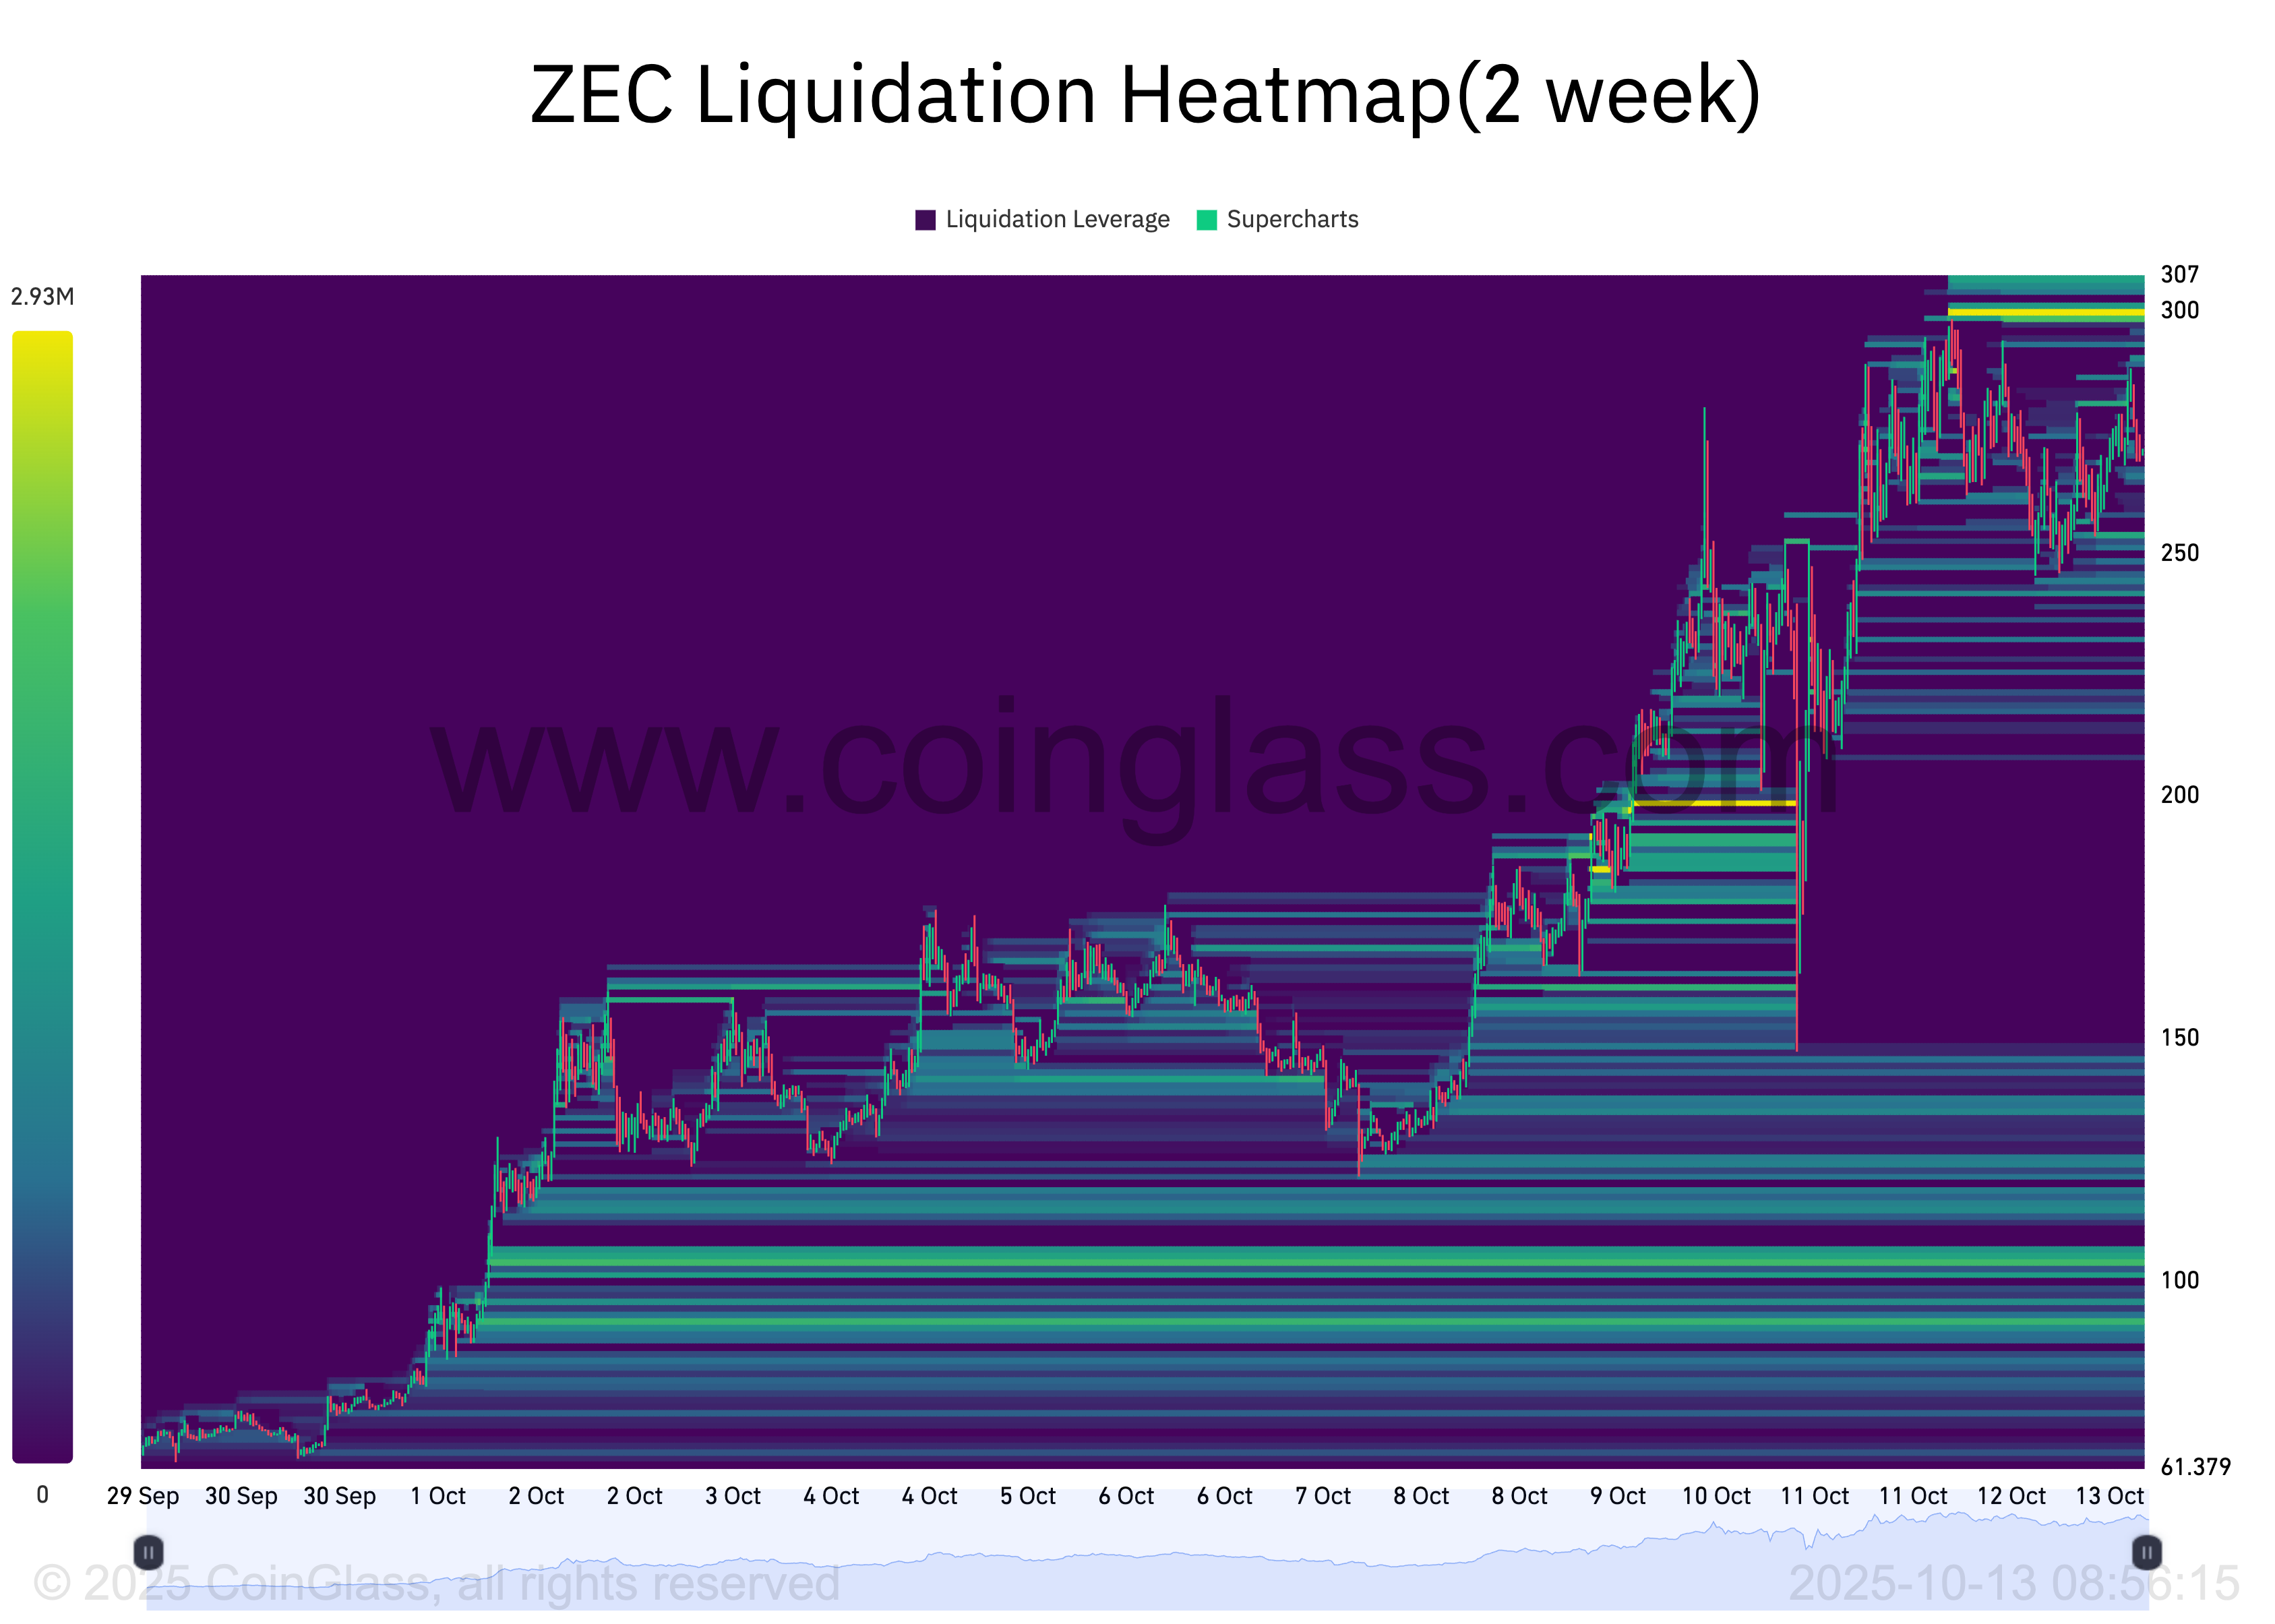
Liquidation heatmaps help traders spot price levels where a large number of Leveraged positions could be wiped out. They highlight zones of high liquidity, often color-coded, with brighter areas indicating heavier liquidation potential.
Usually, these zones act as magnets for price action, as the market tends to MOVE toward these areas to trigger liquidations and open fresh positions.
For ZEC, the concentration of liquidity around $300.56 signals strong trader interest in buying or closing short positions at that price, pointing to the possibility of a near-term price rally.
Furthermore, on the daily chart, the setup of ZEC’s Moving Average Convergence Divergence (MACD) confirms this bullish outlook. At press time, the token’s MACD line (blue) rests above its signal line (orange), a trend widely regarded as a bullish momentum signal.
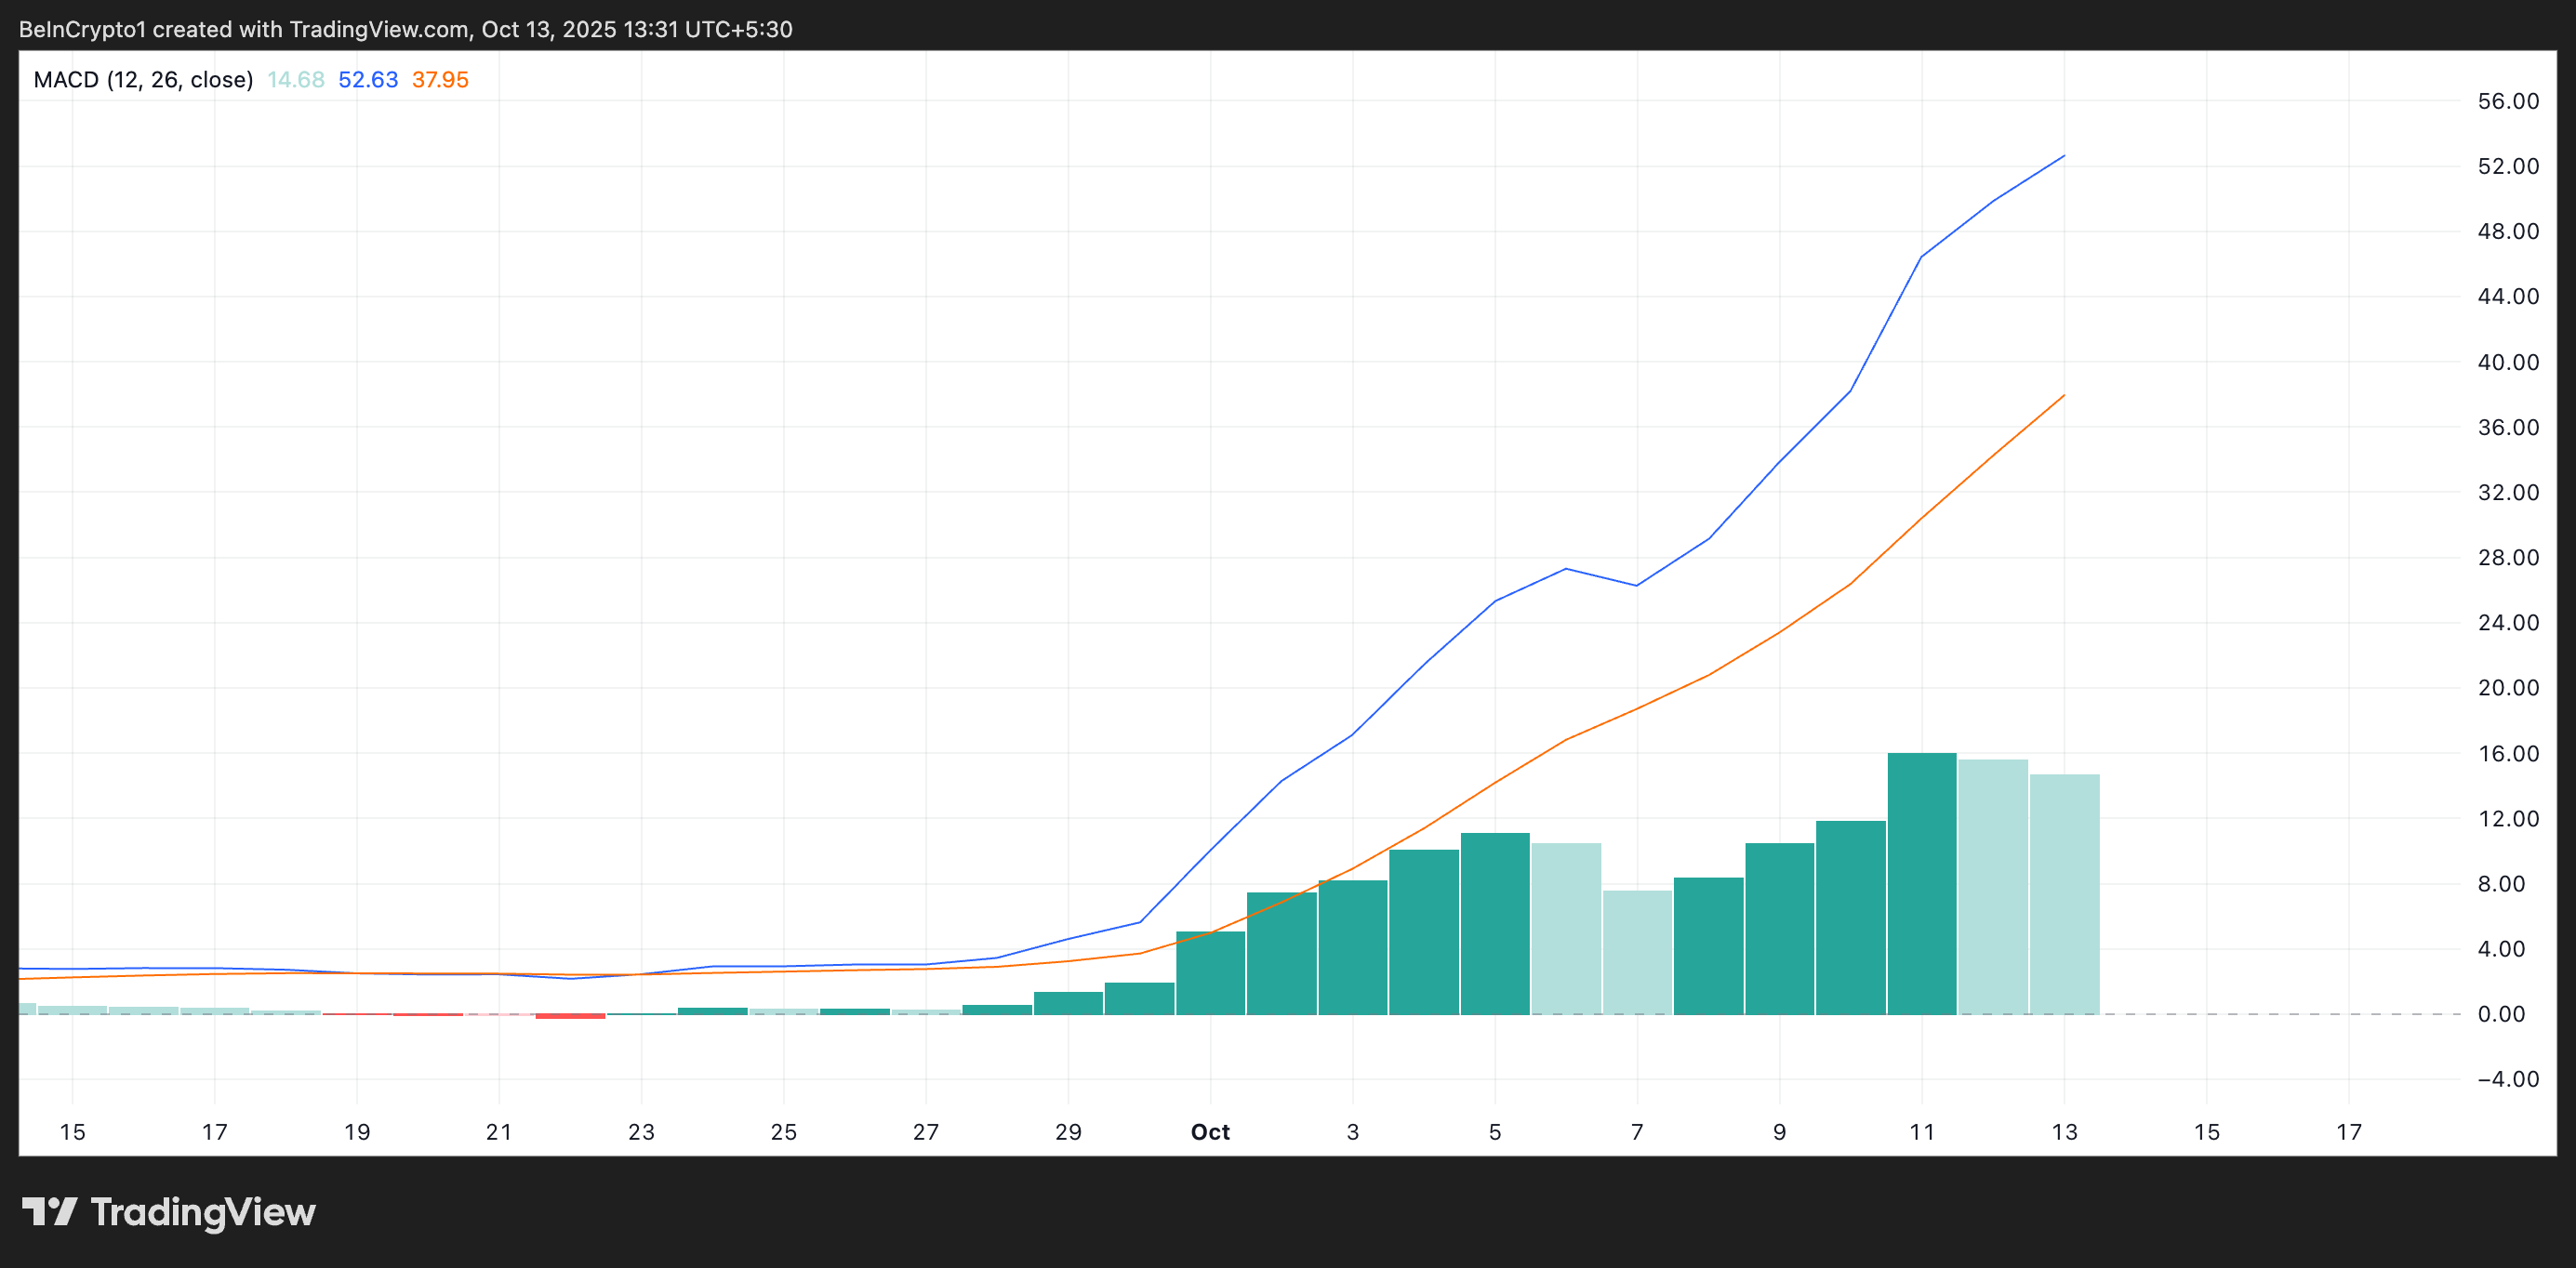
An asset’s MACD indicator identifies trends and momentum in its price movement. It helps traders spot potential buy or sell signals through crossovers between the MACD and signal lines.
When the MACD line is above the signal line, it indicates buy-side pressure and suggests that ZEC’s price may continue to rise.
Can Buyers Hold the Line at $270?
If this accumulation trend continues, ZEC could sustain its rally, climb above the psychological $300 level, and regain its four-year high of $305.
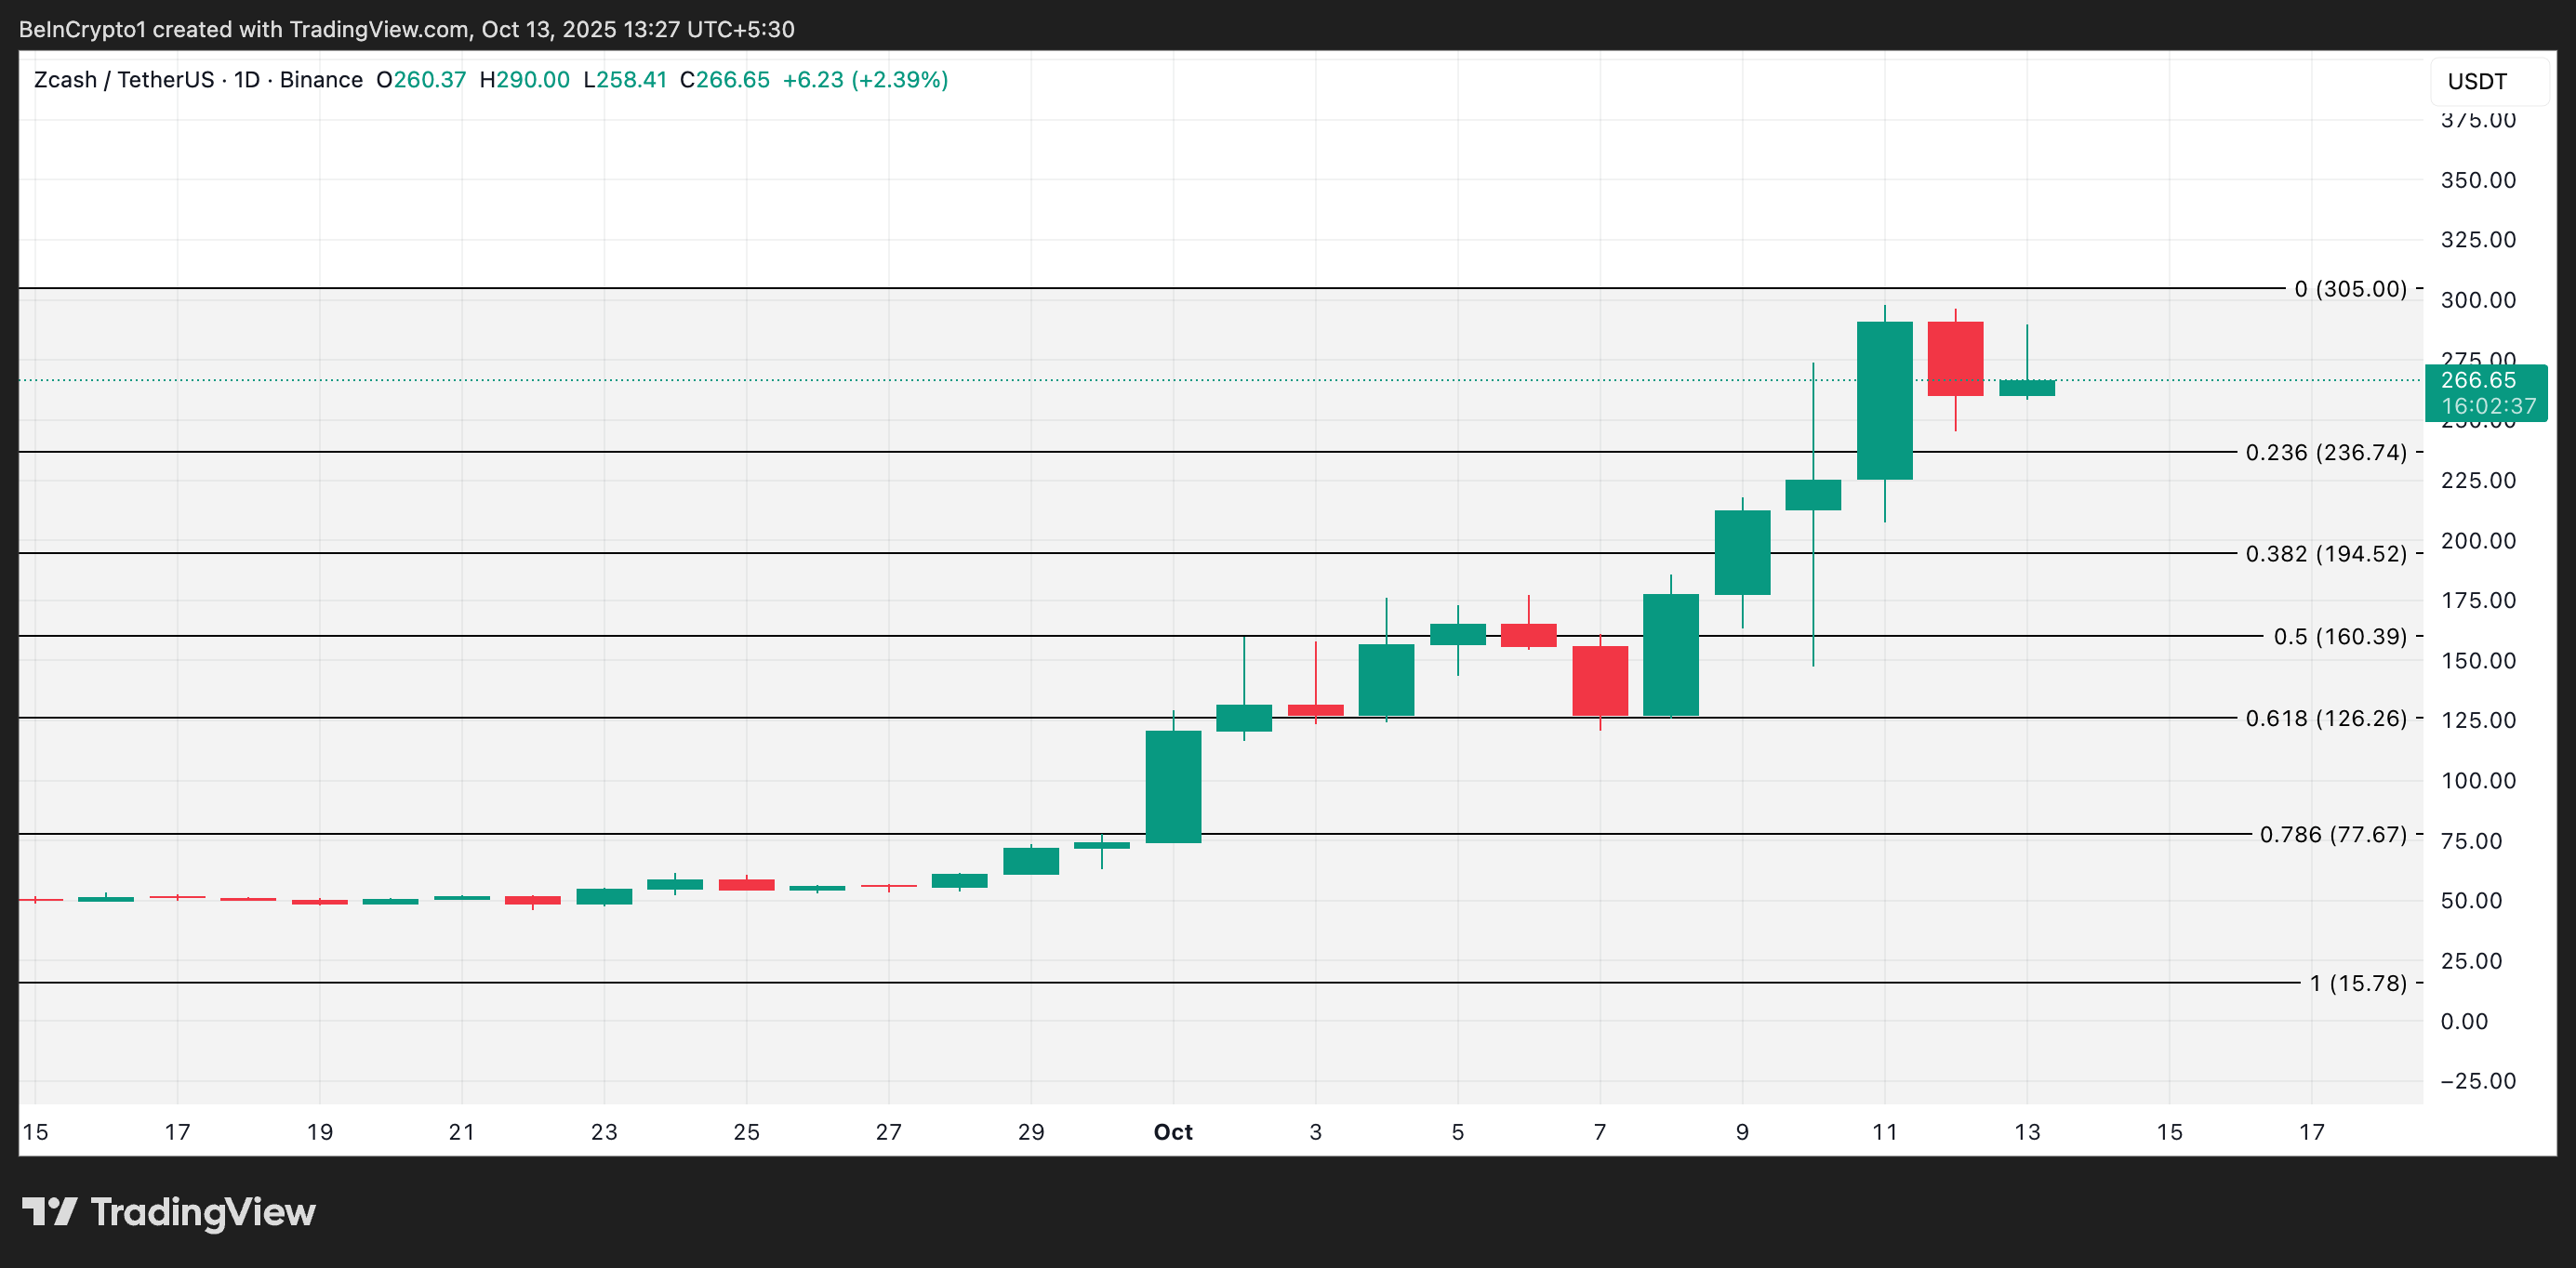
However, failing to maintain buying pressure around $270 may expose it to short-term corrections before another upward leg. In this scenario, its price could fall below the support at $234.74 and dip toward $194.52.
