Bitcoin’s Bearish Grip Tightens After ’The Great Reset’ — But This Single Price Level Could Spark The Reversal

Bitcoin continues trading in bearish territory following the market-wide 'Great Reset' event—yet technical analysts are watching one critical support level that could flip the entire narrative.
The Make-or-Break Zone
Market sentiment remains cautious as Bitcoin struggles to regain momentum post-reset. Trading volumes have dipped 23% week-over-week while institutional inflows show signs of stagnation. The cryptocurrency has tested key resistance levels three times in the past fortnight, failing to sustain breakthroughs each time.
Technical analysts point to the $38,500 level as the crucial threshold. A decisive close above this price point with strong volume could trigger algorithmic buying and shift market psychology from defensive to opportunistic. Current derivatives data shows leveraged longs building quietly beneath the surface, waiting for confirmation.
Meanwhile, traditional finance pundits continue their usual chorus of 'I told you so'—apparently forgetting their own track records with subprime mortgages and negative-yielding bonds. The crypto market's volatility remains a convenient scapegoat for portfolio managers who can't beat simple dollar-cost averaging.
All eyes now turn to that single technical level. Break it, and the bears might finally retreat. Hold it, and the consolidation continues. Either way, Bitcoin's next major move is brewing right here.
On-Chain Metrics Hint at Stabilization, but Conviction Still Lags
Despite the cautious price action, on-chain data suggests the foundation for recovery is forming.
The Net Unrealized Profit/Loss (NUPL) — a metric showing whether investors are sitting on paper profits or losses — dropped to 0.50 on October 11, its lowest level since April. This shows most traders have absorbed their losses, often a sign that the selling phase is NEAR exhaustion.
Sign up for Editor Harsh Notariya’s Daily crypto Newsletter here.
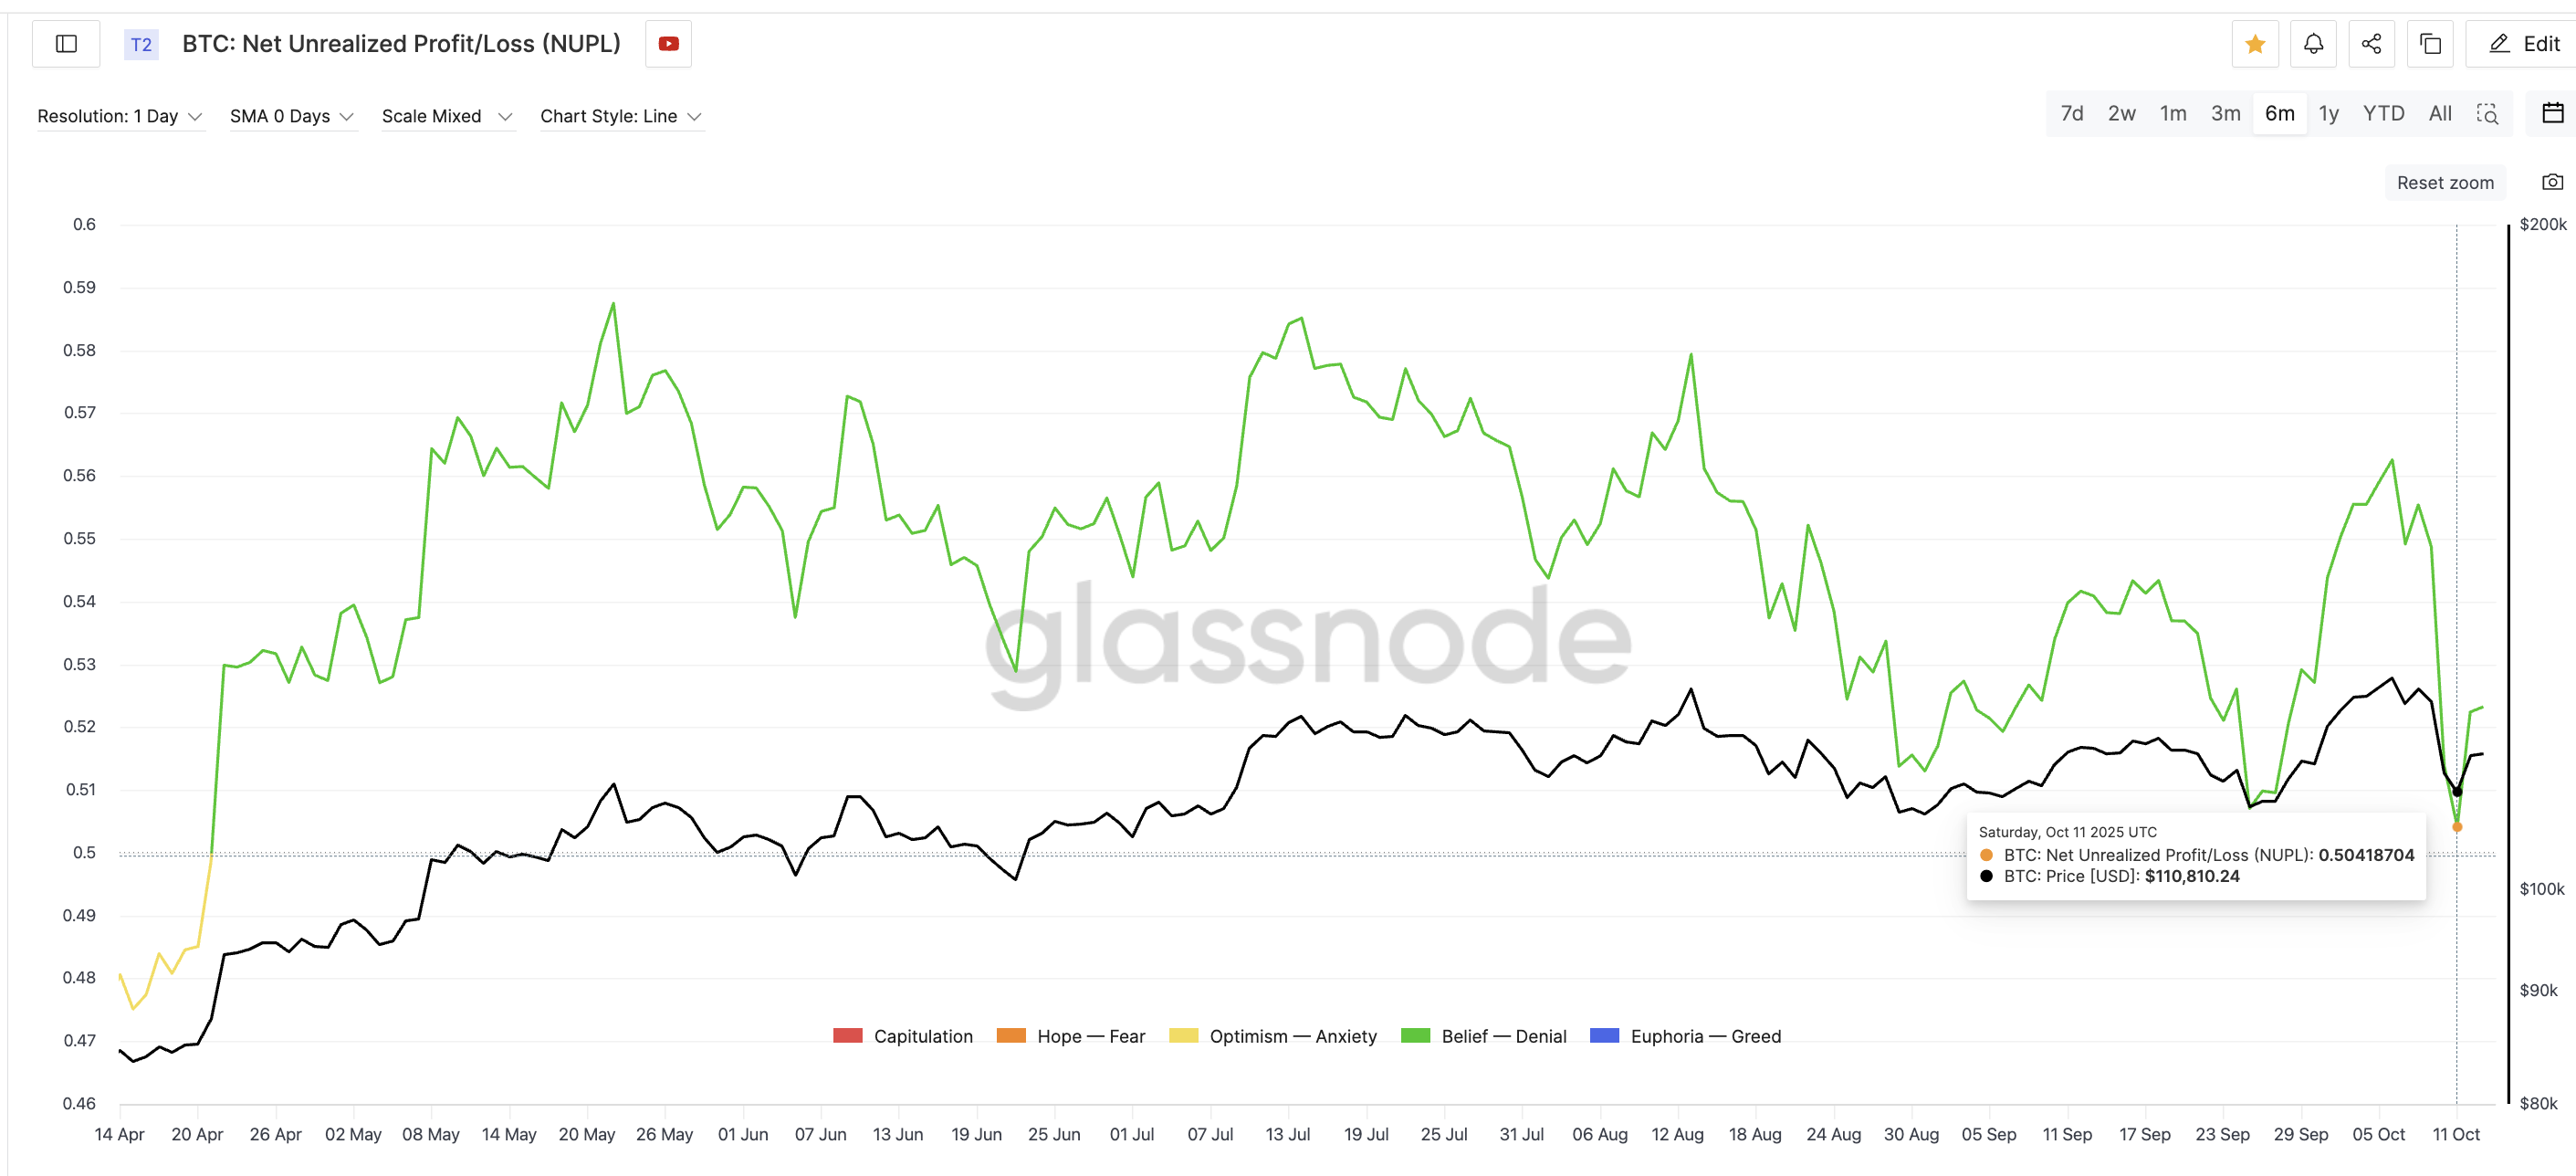
The last time NUPL moved close to this level was on September 25, when Bitcoin formed a local bottom around $109,000 and rebounded to $124,000 within two weeks. That’s a 14% rise.
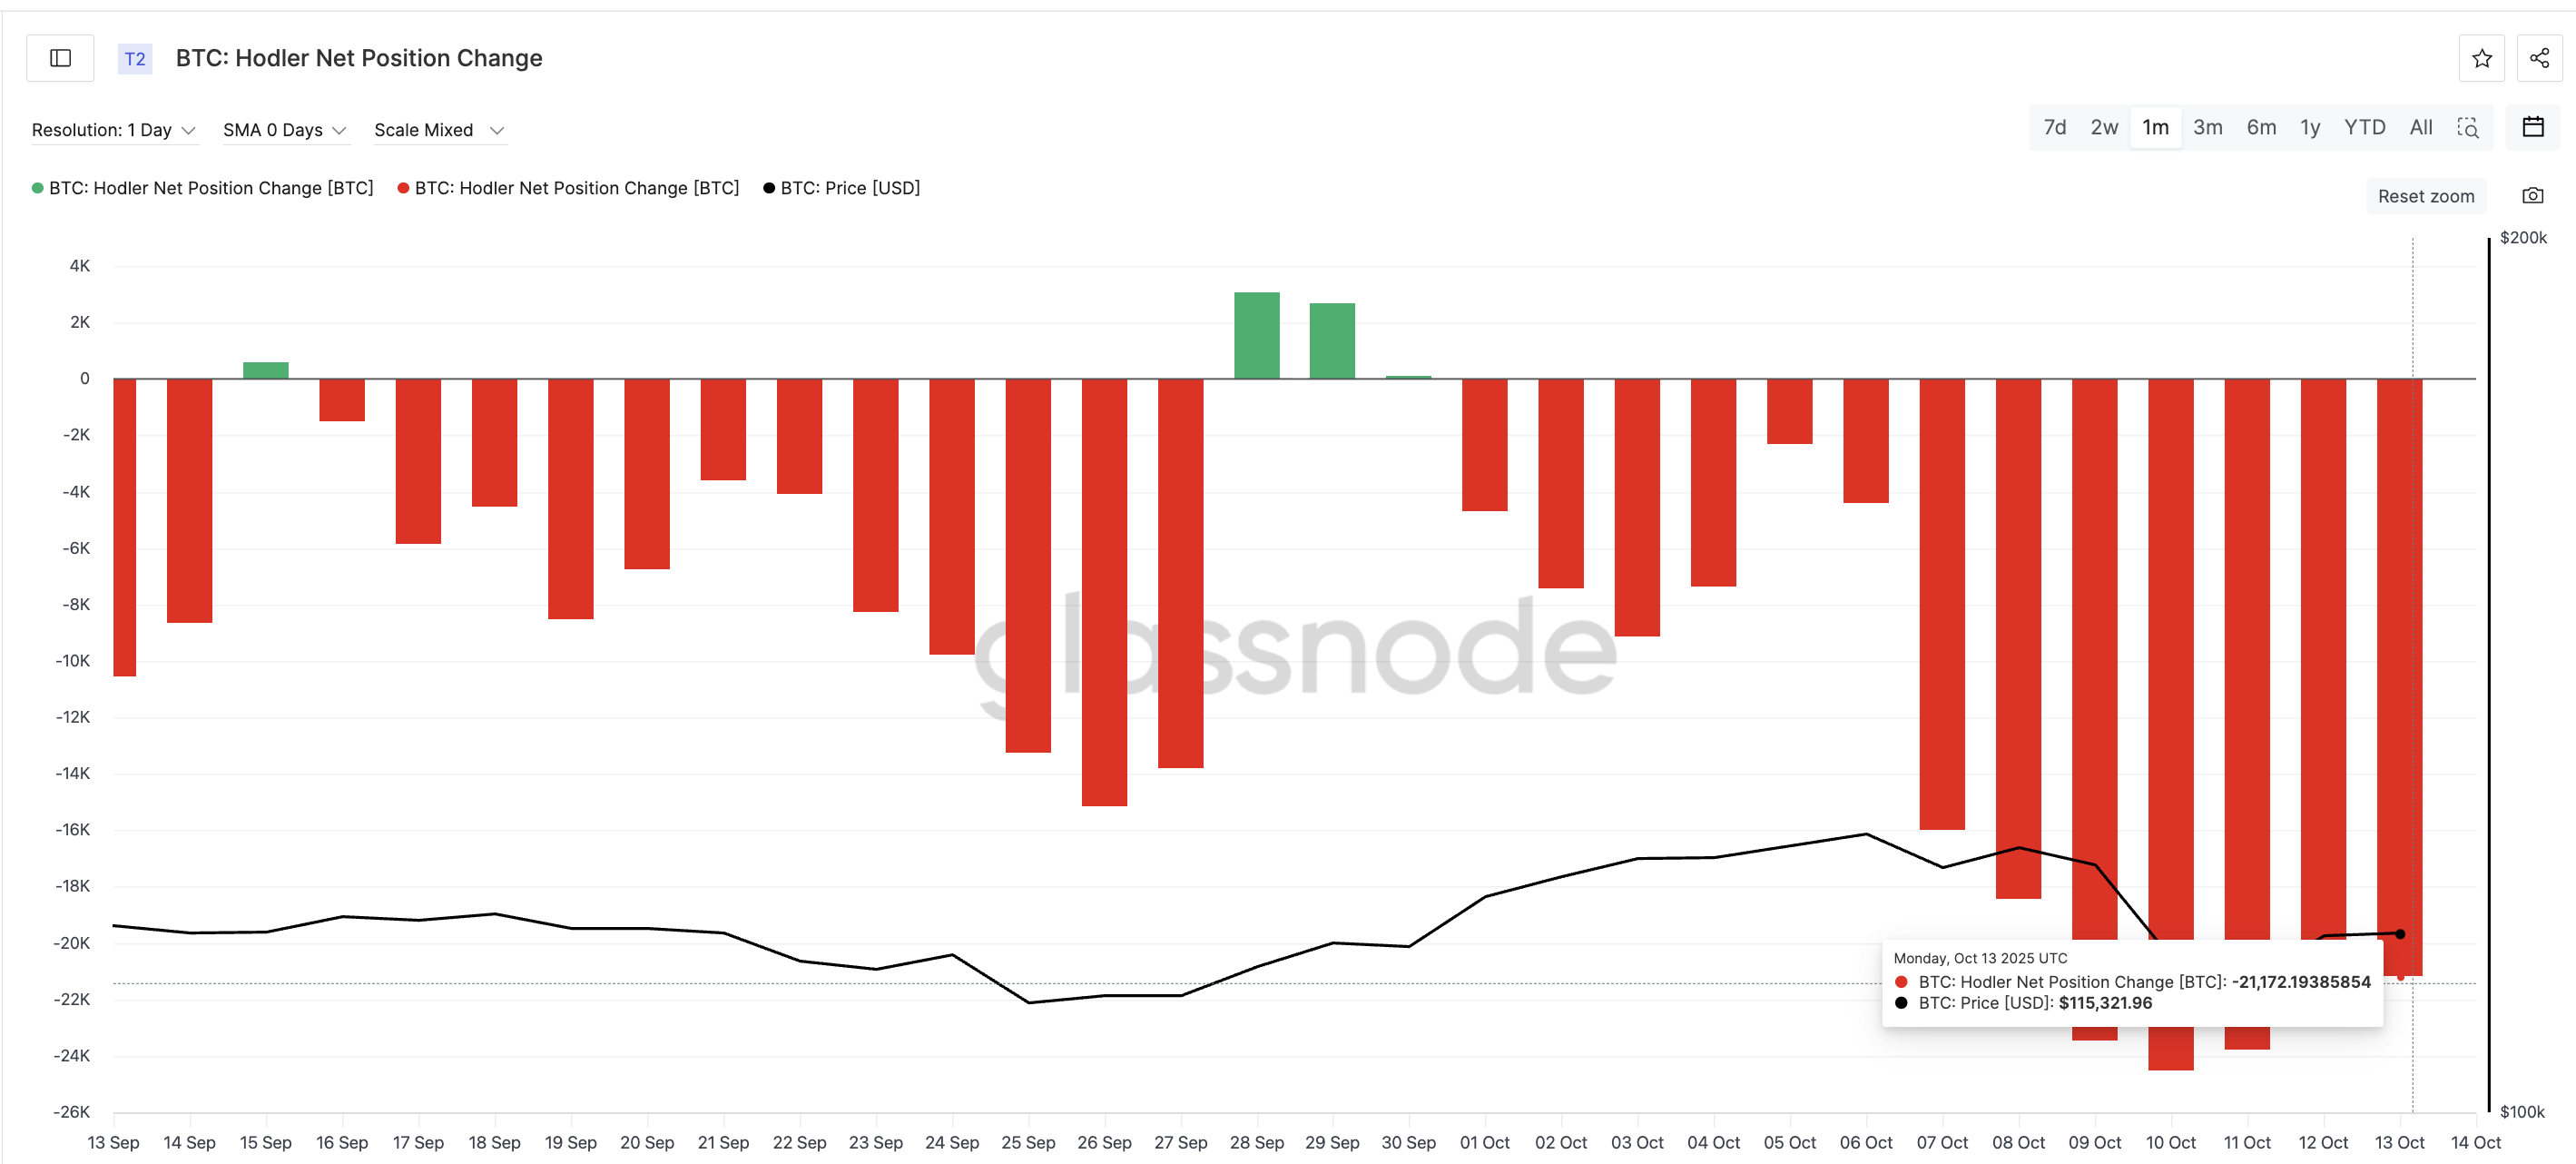
The Holder Net Position Change, which tracks how much bitcoin long-term investors are buying or selling, is also improving.
It turned less negative after the crash, rising from –24,506 BTC on October 10 to –21,172 BTC by October 13 (a 14% improvement) — showing that long-term holders are gradually returning to accumulation. That shift means the heavy selling pressure seen during the liquidation phase is easing. Yet, the conviction lags until the net position change flips green or buyer-specific.
Shawn Young, Chief Analyst at MEXC Research, told BeInCrypto that the crash or the reset marked a necessary “cleansing” moment for the market:
“In many ways, the “Great Reset” has strengthened Bitcoin’s fundamental narrative”, he said
Young also highlighted the key cleansing catalyst here:
“Bitcoin’s swift recovery towards $115,000, following the largest liquidation event in crypto history, reveals how resilient and mature the market has become. The $20 billion leverage wipeout that followed President Trump’s tariff announcement was a wake-up call for traders, revealing how fragile risk sentiment can become. The forceful unwinding removed a substantial LAYER of speculative exposure, effectively cleansing the system and setting the tone for a more sustainable uptrend movement”, he added.
Young’s exclusive commentary to BeInCrypto highlights catalysts beyond hodler net position change and NUPL:
“U.S. spot Bitcoin ETFs only recorded a modest outflow of over $4 million and still saw over $2.7 billion in weekly inflows, signaling that smart money is still betting on Bitcoin’s safe-haven and debasement trade narrative”, he highlighted.
Together, the data suggest that while short-term sentiment is cautious, structural strength is quietly returning beneath the surface.
Bitcoin Price Still Bearish — $125,800 Breakout Could Flip Trend
On the daily chart, Bitcoin continues to trade inside a rising wedge — a pattern that often signals indecision or exhaustion after a strong rally. Following the crash, BTC found support near $111,100 (0.236 Fibonacci level), where buyers have repeatedly defended the level.
Since then, the price has hovered between $113,900 and $115,100, with momentum capped below $119,200. As the first hurdle, the Bitcoin price needs a daily close above $115,100 to gain some strength. Yet, a clean daily close above $125,800 remains the key level to watch for the entire structure to turn bullish.
That WOULD confirm a breakout above the wedge’s upper boundary and could open the path beyond $126,200, Bitcoin’s previous all-time high.
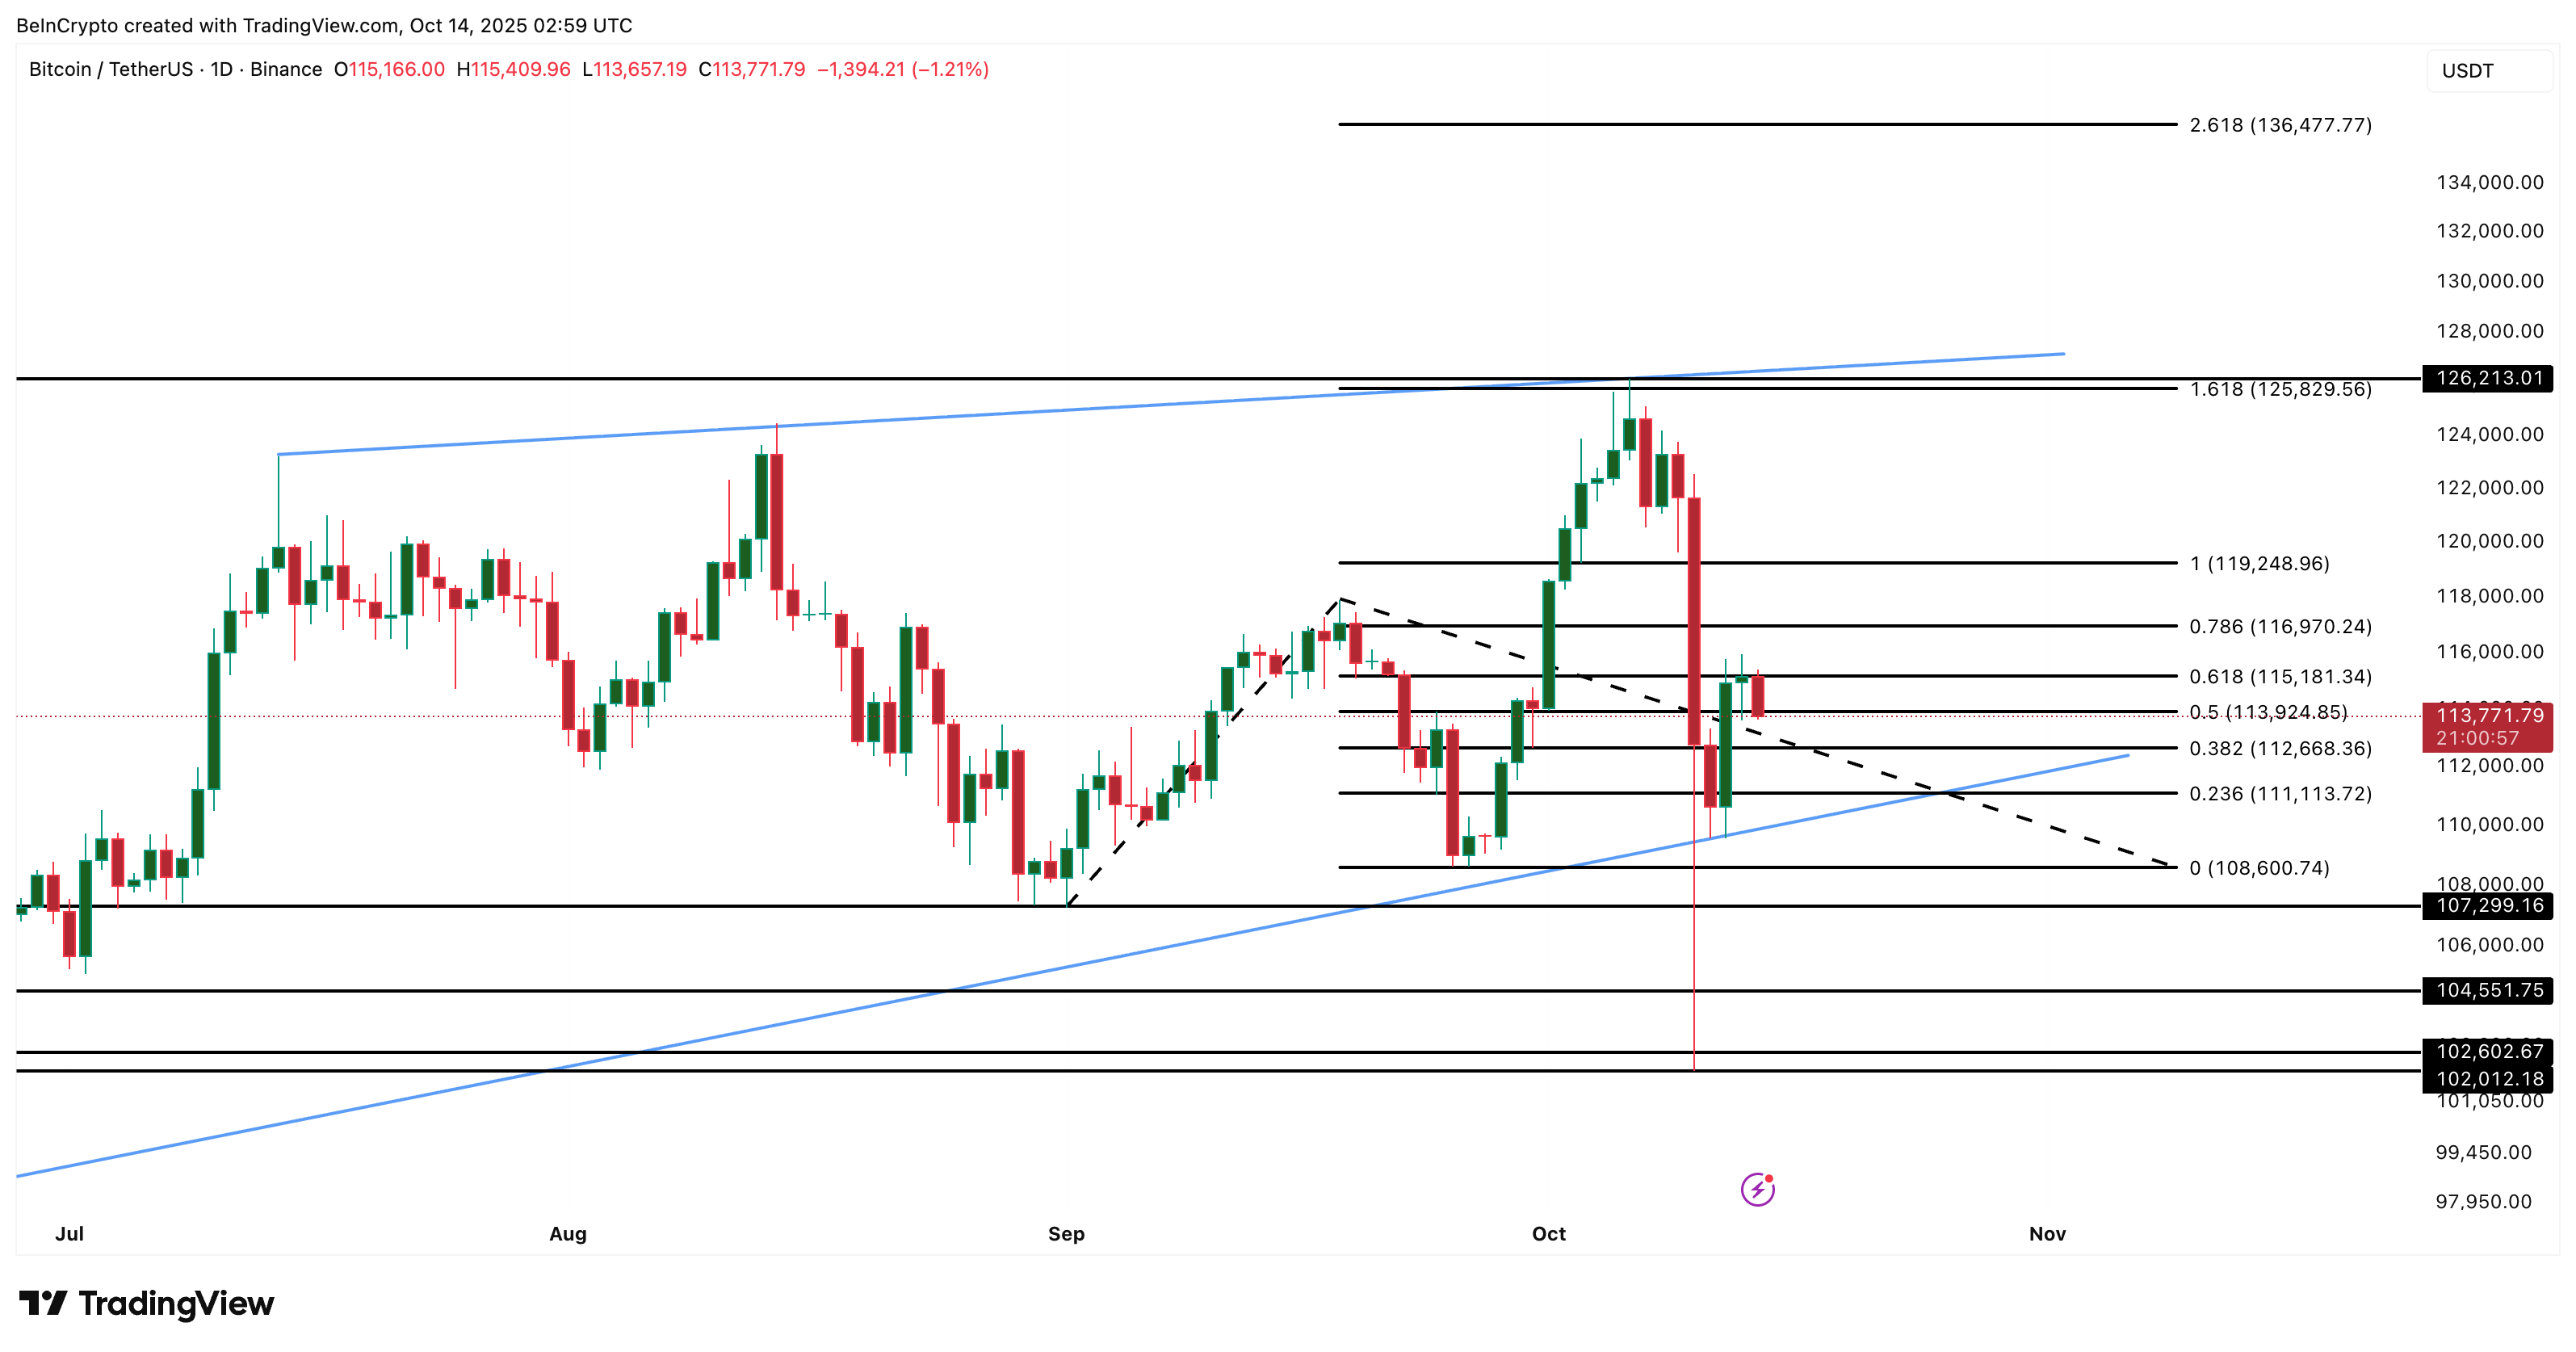
If momentum strengthens beyond that, the Fibonacci extension targets point toward $136,400 as the next potential leg higher.
Shawn Young’s commentary also validates this chart-led view:
“Should BTC continue to hold above the $110,000 support zone, we could see momentum rebuild towards retesting and breaching $126,000, a MOVE which unlocks the path to $130,000 as the market re-prices growth expectations”, he mentioned
However, until such a breakout occurs, Bitcoin’s trend remains fragile. Failure to clear $119,200 could invite renewed selling, while losing $111,100 would risk deeper corrections toward $104,500 and $102,000.
Young said Bitcoin’s short-term trend remains downward, but also highlighted some key levels:
“BTC now seems to be in a downward trend in many short-term time frames and needs to break above $120,000 again to invalidate these bearish setups. A break above $122,000 would confirm that the market has fully absorbed the impact of last week’s market storm and is ready to make new market highs”, he added.
