HBAR Price Battles at $0.16 Support — One Strategic Move Could Squeeze Bearish Traders

HBAR stands at the precipice—testing critical support that could define its next major trend.
The $0.16 Defense Line
Hedera's native token finds itself wrestling with the $0.16 level, a battleground where bulls and bears clash for control. This isn't just another price point—it's the line in the sand that separates recovery from further decline.
Technical Setup Favors Optimists
Current chart patterns suggest trapped liquidity below current levels. A decisive bounce from this zone could trigger a cascade of short covering—forcing bearish traders to scramble for exits while bulls capitalize on the momentum shift.
Market Mechanics at Play
The cryptocurrency's structure shows accumulation patterns near support, with larger addresses increasing positions while retail sentiment remains divided. Sometimes the market's greatest gains come from other people's poor risk management—a classic Wall Street tradition now perfected in crypto.
All eyes on whether HBAR can defend this crucial level and spring the trap on overconfident shorts.
Selling Pressure Fades as Bearish Bets Stack Up — Short Squeeze Likely?
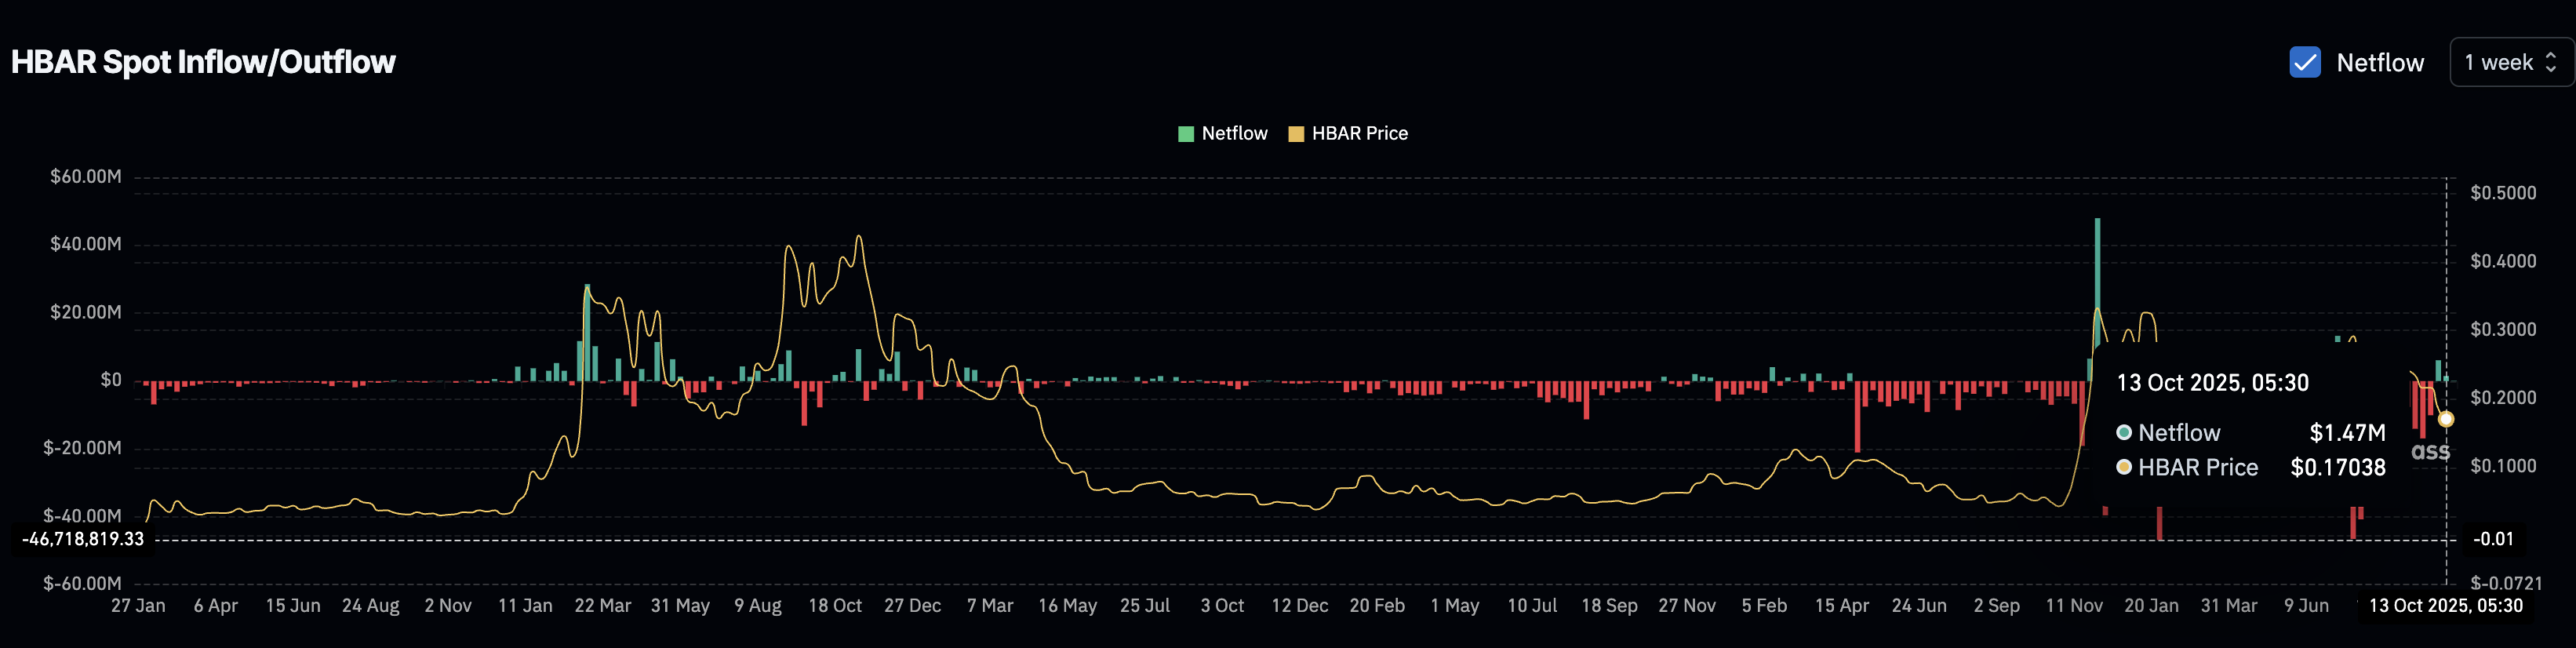
The amount of HBAR moving to exchanges has dropped sharply, which usually signals investors are holding instead of selling. Between October 13 and 20, weekly exchange inflows fell from $6.13 million to $1.47 million — a 76% decline.
A similar pattern appeared in late June, when inflows collapsed from $7.72 million to $632,000 (a 90% drop). Within a month, HBAR’s price almost doubled from $0.13 to $0.29.
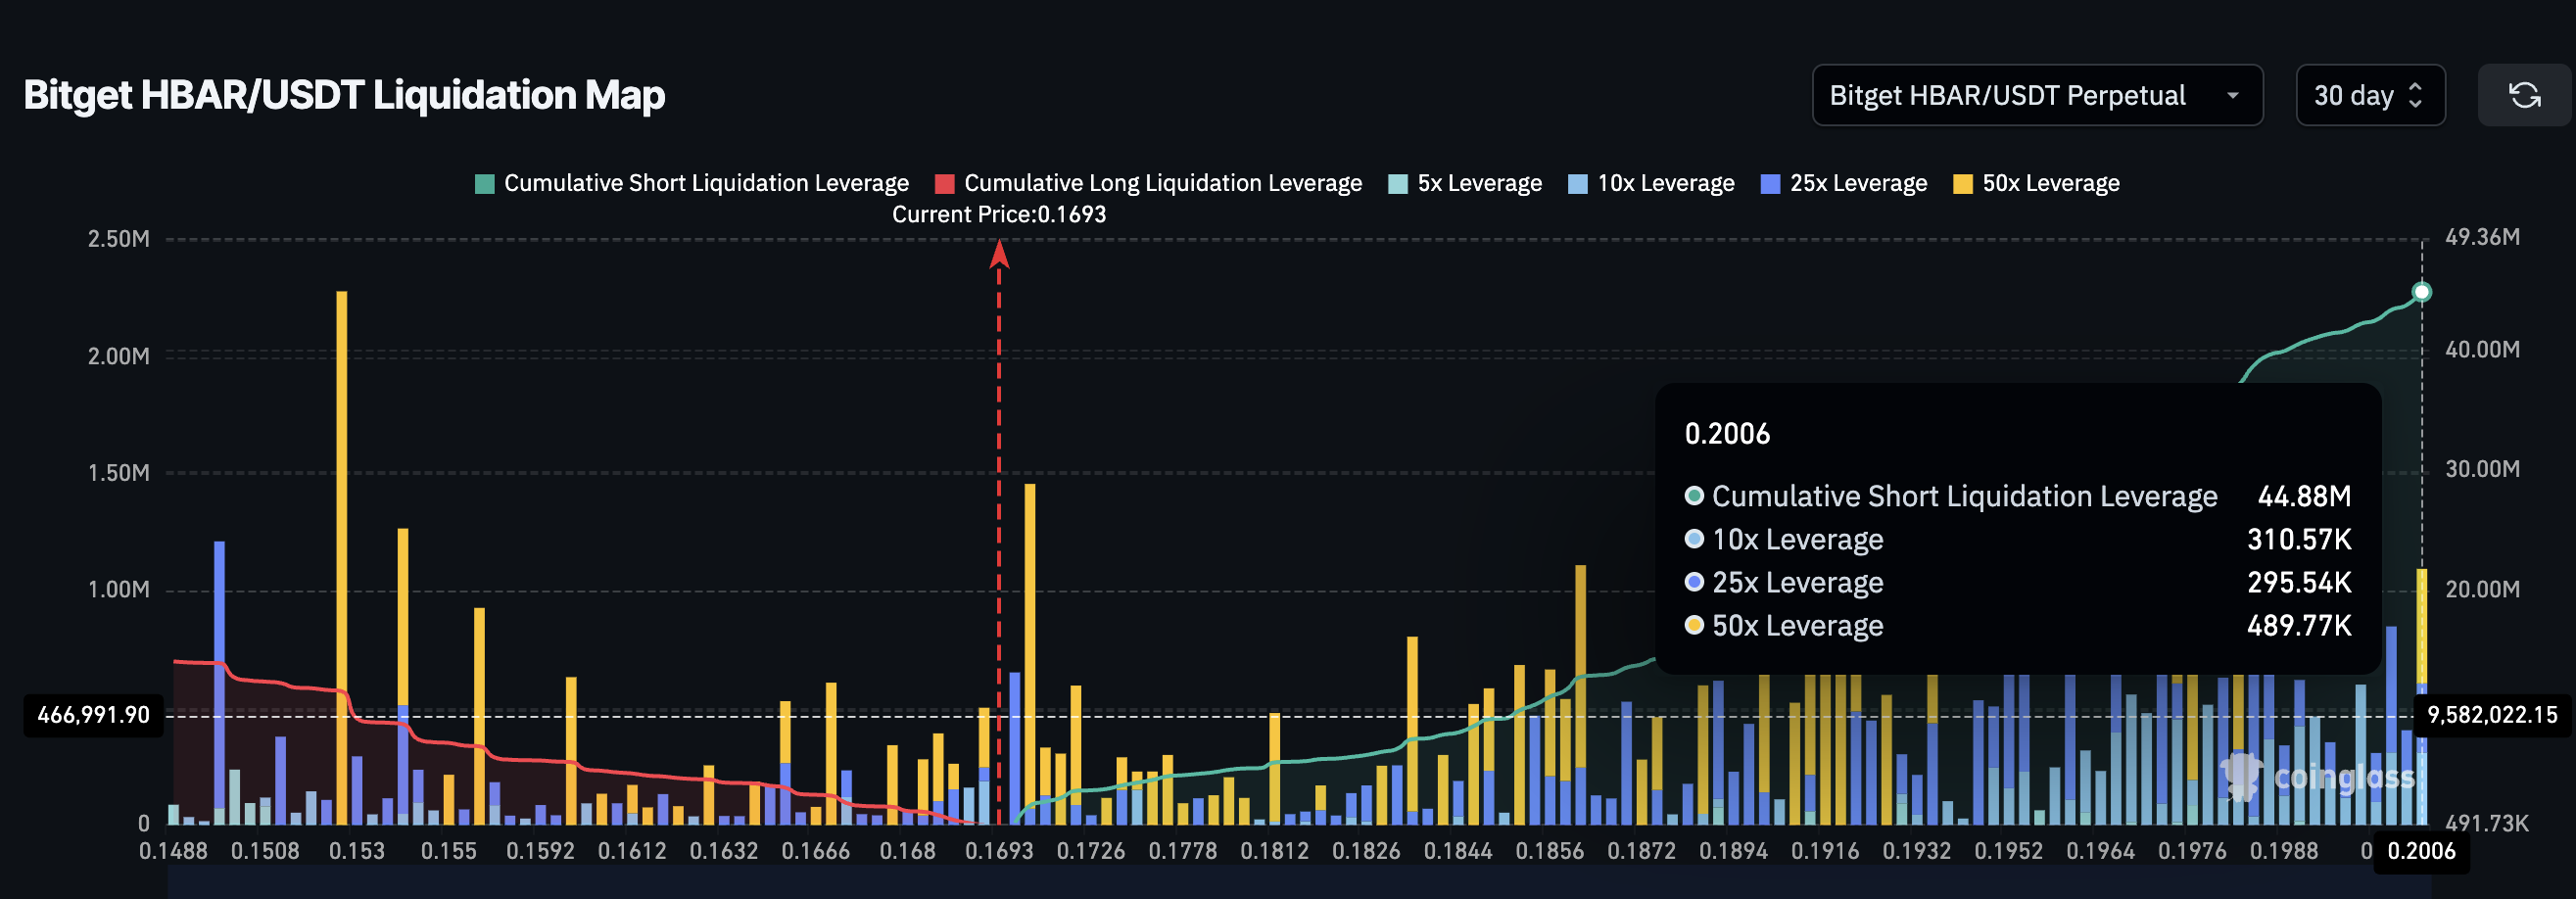
At the same time, traders in the futures market are heavily positioned for a drop. Short bets total $44.88 million, compared to only $14.11 million in long positions. This means that 76% of the traders expect more downside, but that imbalance can quickly backfire.
Many short positions will be forced to close if the HBAR price closes above $0.19, where the biggest liquidation cluster sits. A MOVE of about 15% from current prices could trigger buying pressure (via short squeeze) as those shorts unwind.
That mix — less selling on exchanges and too many traders betting against HBAR — could fuel a surprise rally if the price holds above $0.16 long enough to test higher levels.
HBAR Price Needs to Hold $0.16 Before Bulls Can Take Over
HBAR’s price structure still leaves room for recovery, but everything now depends on how it behaves around $0.16 and $0.19. The token continues to trade inside a broadening wedge — a formation where both trendlines move apart, often signaling growing volatility and a potential breakout if buyers regain control.
If HBAR holds above $0.16 and breaks past $0.19, it could climb toward $0.23. A close above $0.23 would mean the price has moved beyond the upper trendline of the broadening wedge. That would potentially trigger the short-squeeze event as Leveraged positions unwind. That breakout could pave the way toward $0.25 and $0.30, areas where previous rallies have stalled.
The Relative Strength Index (RSI) — which tracks the speed and strength of price movement — also supports this view. Between June 22 and October 10, HBAR’s price made lower lows while the RSI formed higher lows.
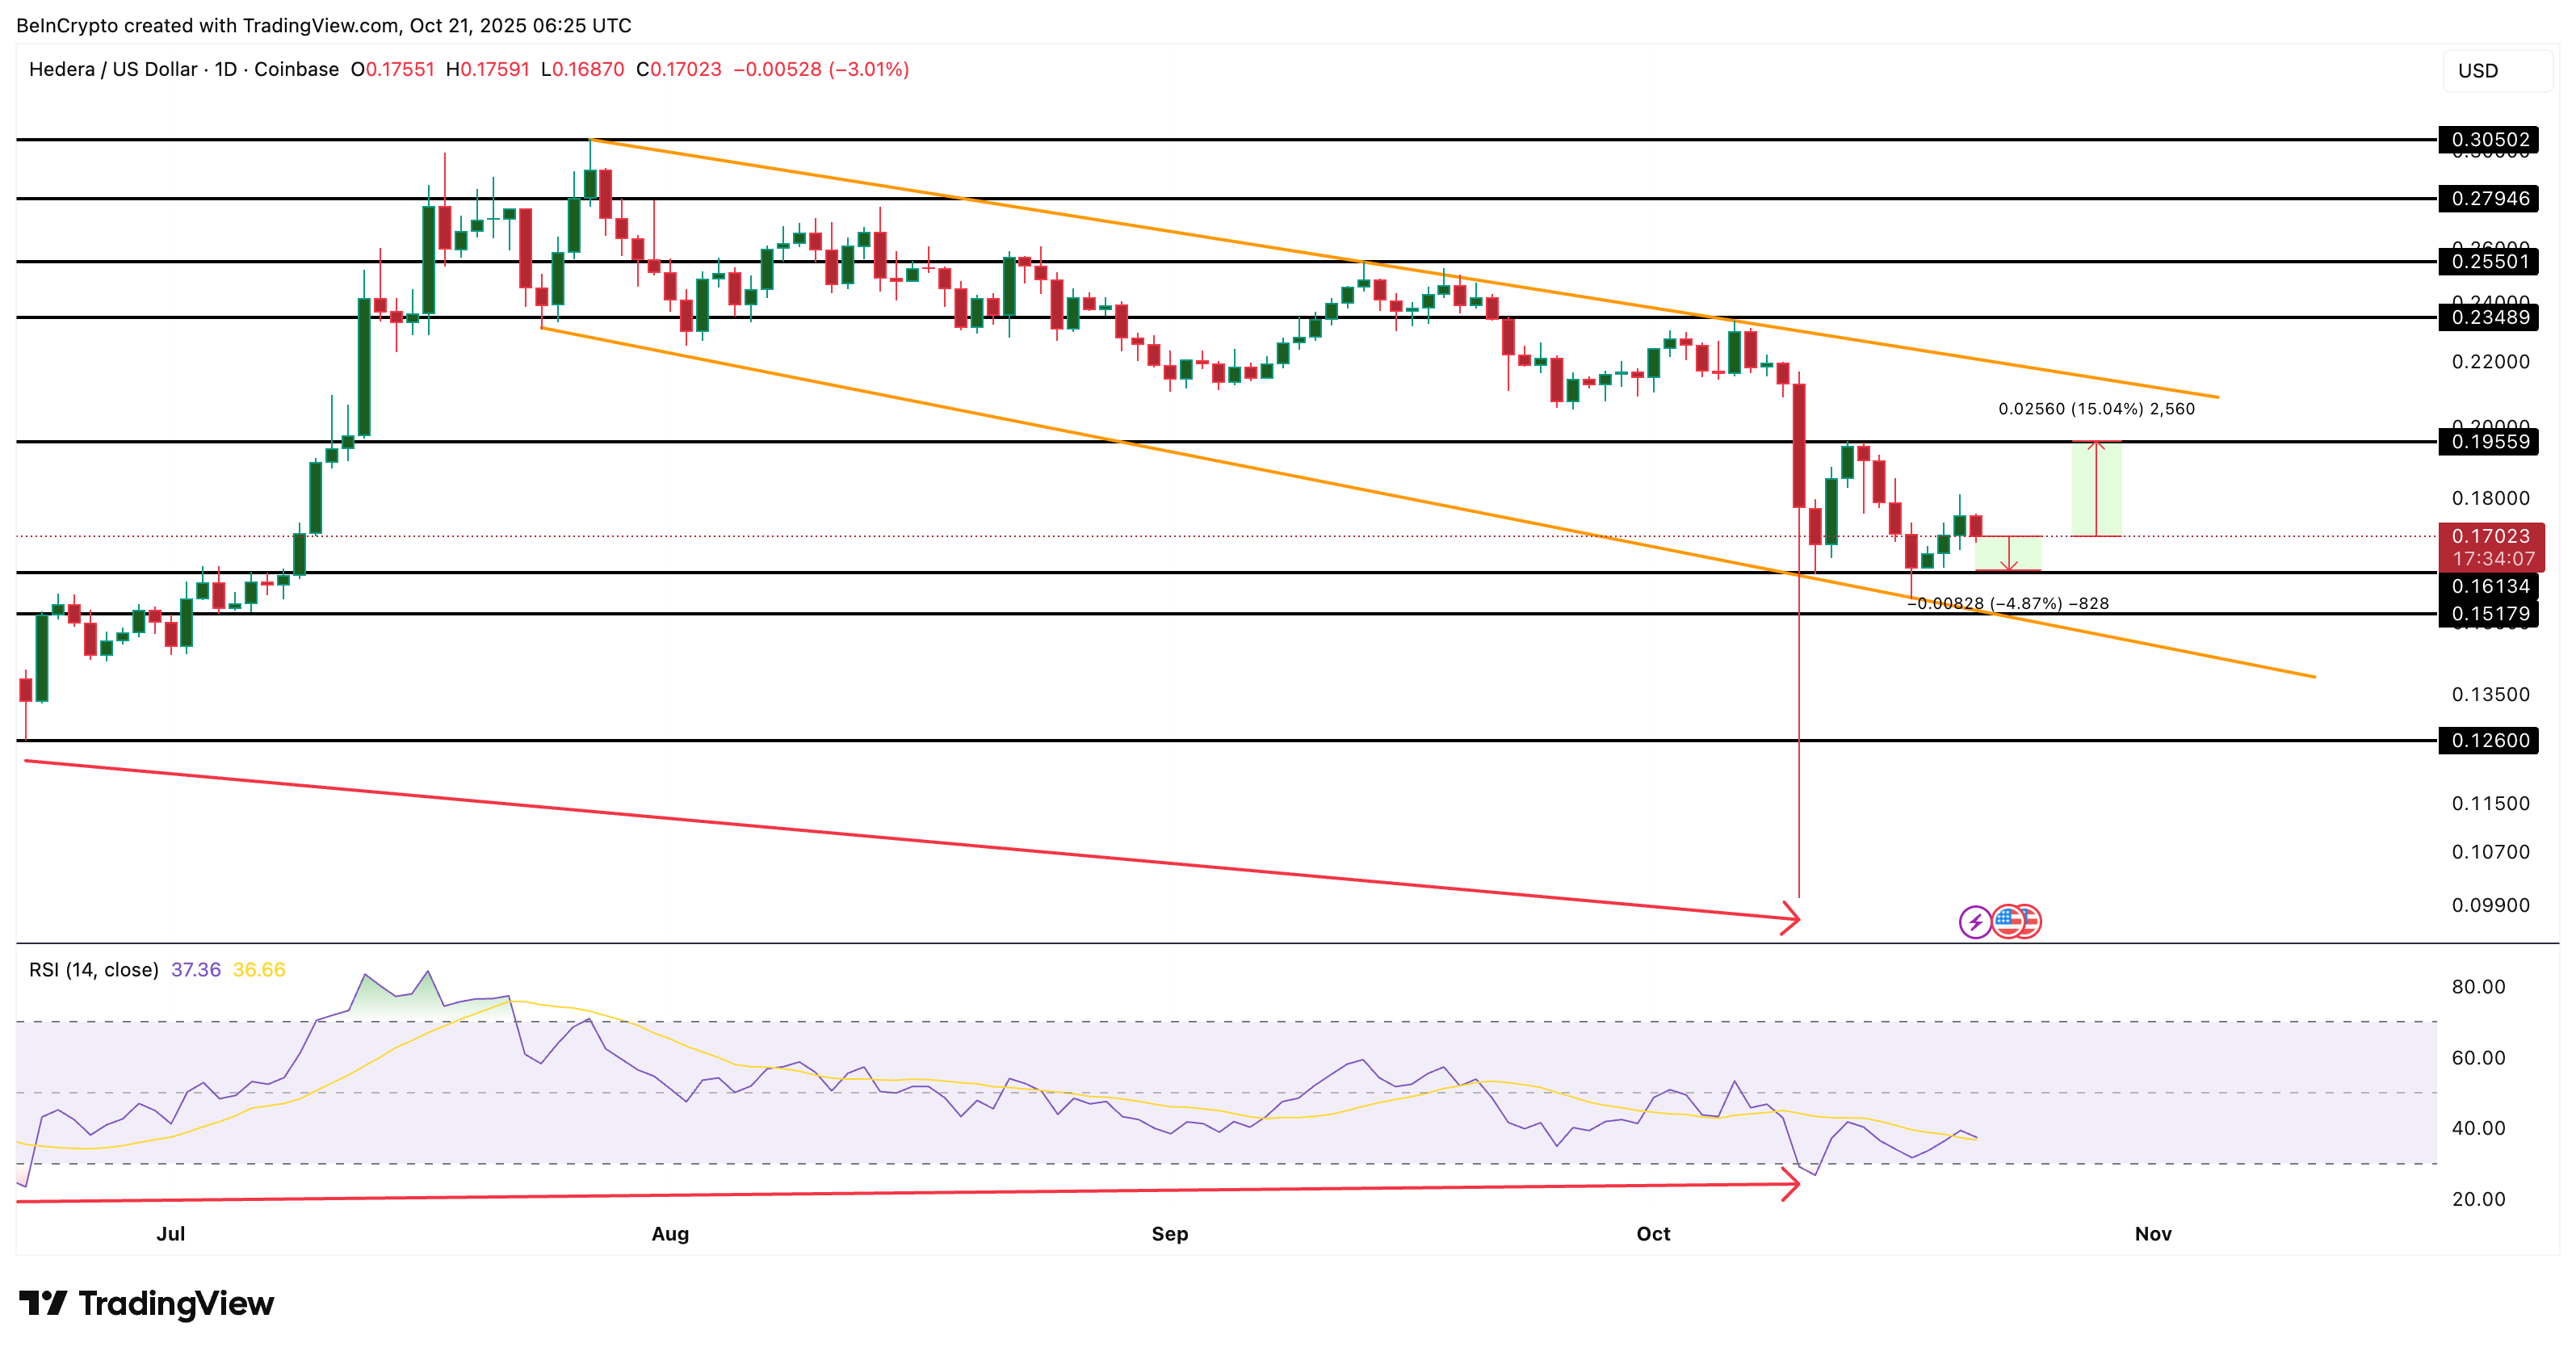
This bullish divergence typically hints that selling pressure is fading even though the price hasn’t yet increased. Combined with a broadening wedge, it strengthens the case for a reversal once HBAR price confirmation arrives.
However, the wedge’s lower trendline is weak since it has only two clear touchpoints. If $0.16 fails and $0.15 breaks, that boundary could give way, dragging HBAR down toward $0.12 and invalidating the rebound setup.
