🚀 Flare (FLR) Surges 15% Amid Explosive Volume—Is This the Start of a Mega Rally?

Flare Network's native token FLR just ripped past resistance—spiking 15% as trading volume went parabolic. Traders are scrambling to decode whether this is the beginning of a sustained uptrend or just another crypto pump-and-dump spectacle.
### The Volume Tells the Story
When a low-cap altcoin suddenly flips the liquidity switch, you pay attention. FLR's volume surge suggests either smart money positioning or retail FOMO—both can move markets, but only one leaves bagholders.
### Technicals vs. Fundamentals
The chart screams breakout, but chain metrics will decide if this holds. Smart contract activity and staking yields matter more than Telegram hype when the leverage flushes out.
### Wall Street's Watching (And Probably Missing the Point)
Institutional analysts will call this 'speculative froth' while quietly loading their own bags. Crypto moves faster than their PowerPoint decks—FLR's either building momentum or prepping for a classic 'buy the rumor, sell the news' reversal.
FLR Ignites With 300% Volume Spike
FLR’s trading volume has skyrocketed by over 300% over the past day. This points to heightened demand and confirms the wave of bullish momentum currently driving its price action. As of this writing, the volume totals $70.41 million, marking its highest single-day trading activity since December 3, 2024.
: Want more token insights like this? Sign up for Editor Harsh Notariya’s Daily crypto Newsletter here.
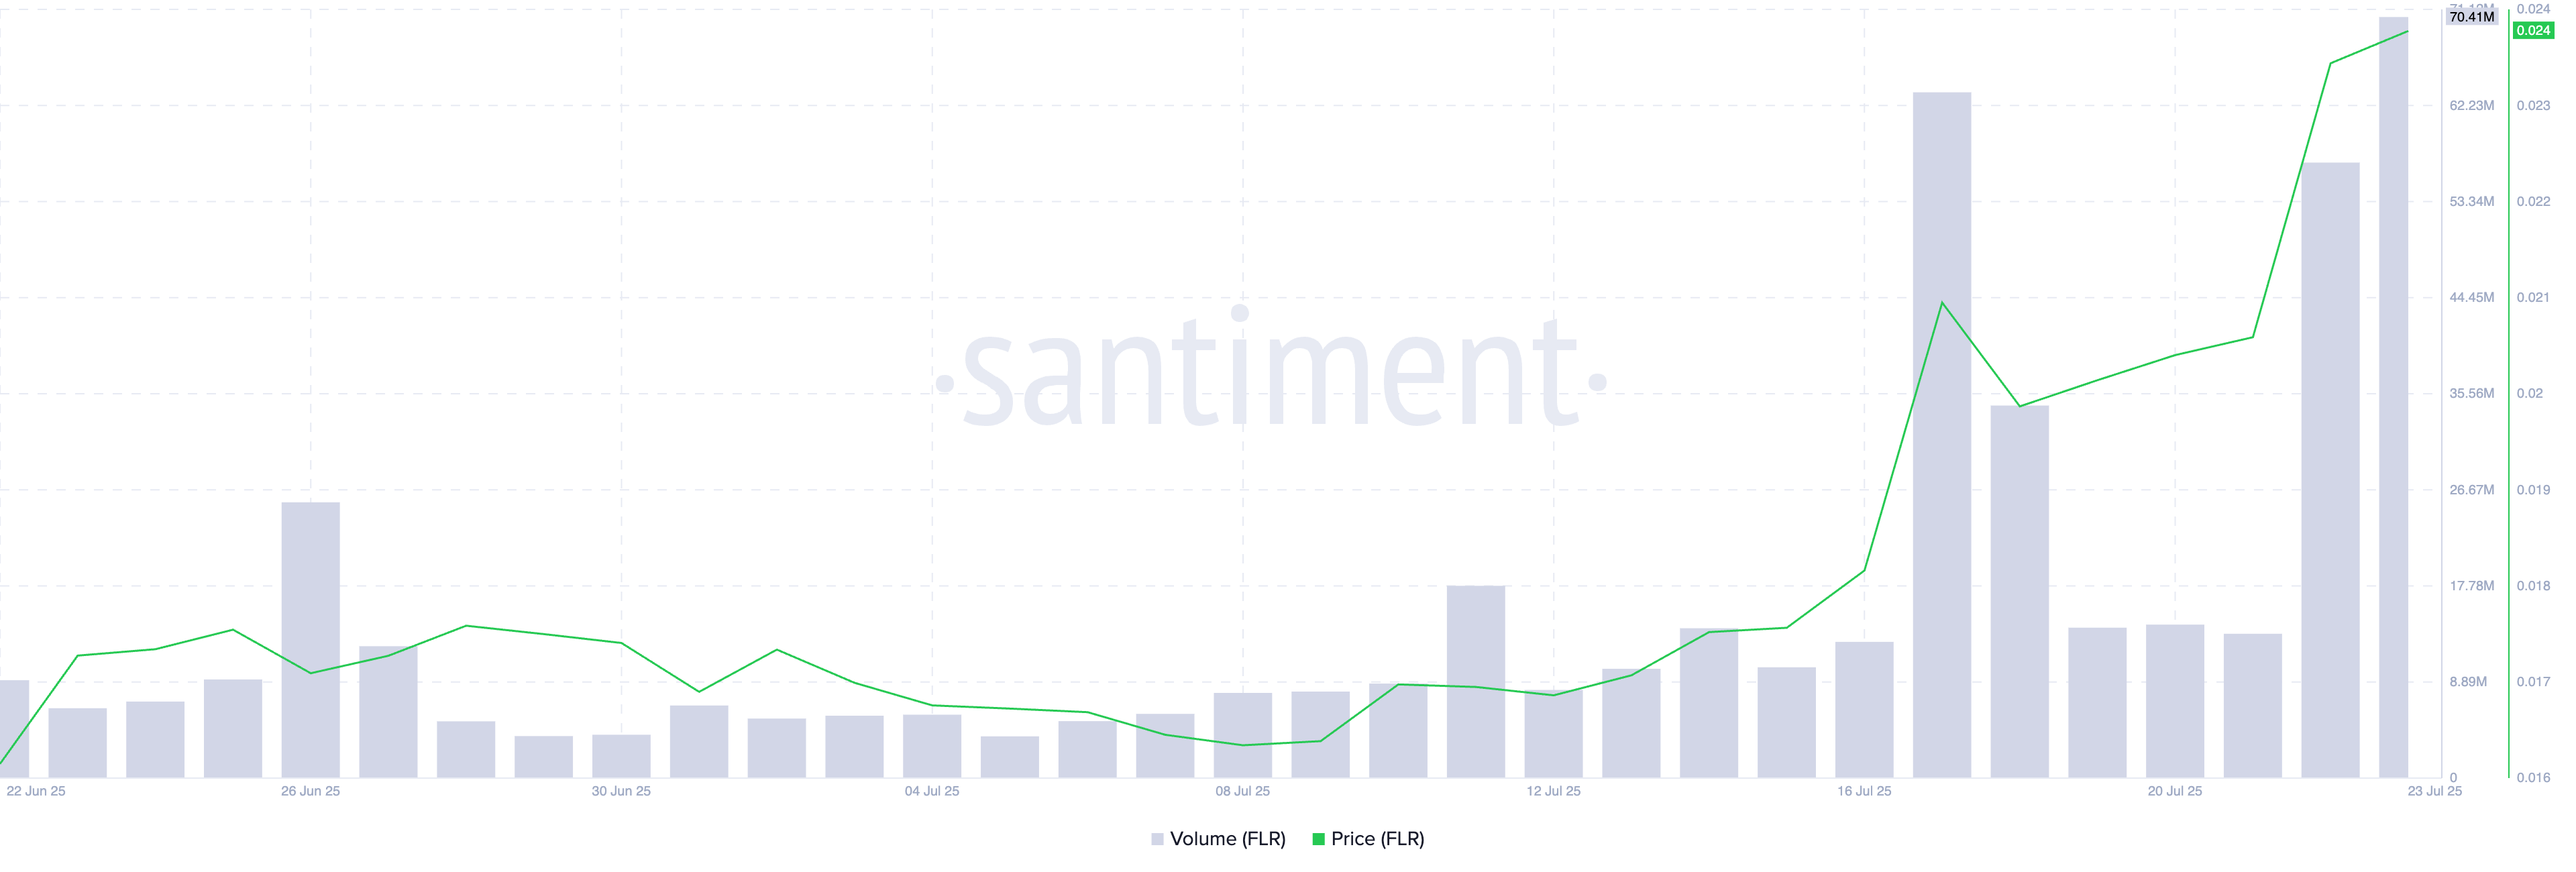
When both price and trading volume rise simultaneously, the rally is supported by conviction. This is important because high volume lends credibility to the price movement, unlike thin, low-volume rallies that often reverse quickly.
In FLR’s case, this trend offers strength to a longer-term rally. This setup often triggers FOMO-driven entries for short-term traders, which could boost FLR’s value over the next trading sessions.
Furthermore, on the one-day chart, FLR trades above its 20-day Exponential Moving Average (EMA), which now acts as dynamic support beneath its price at $0.01948.
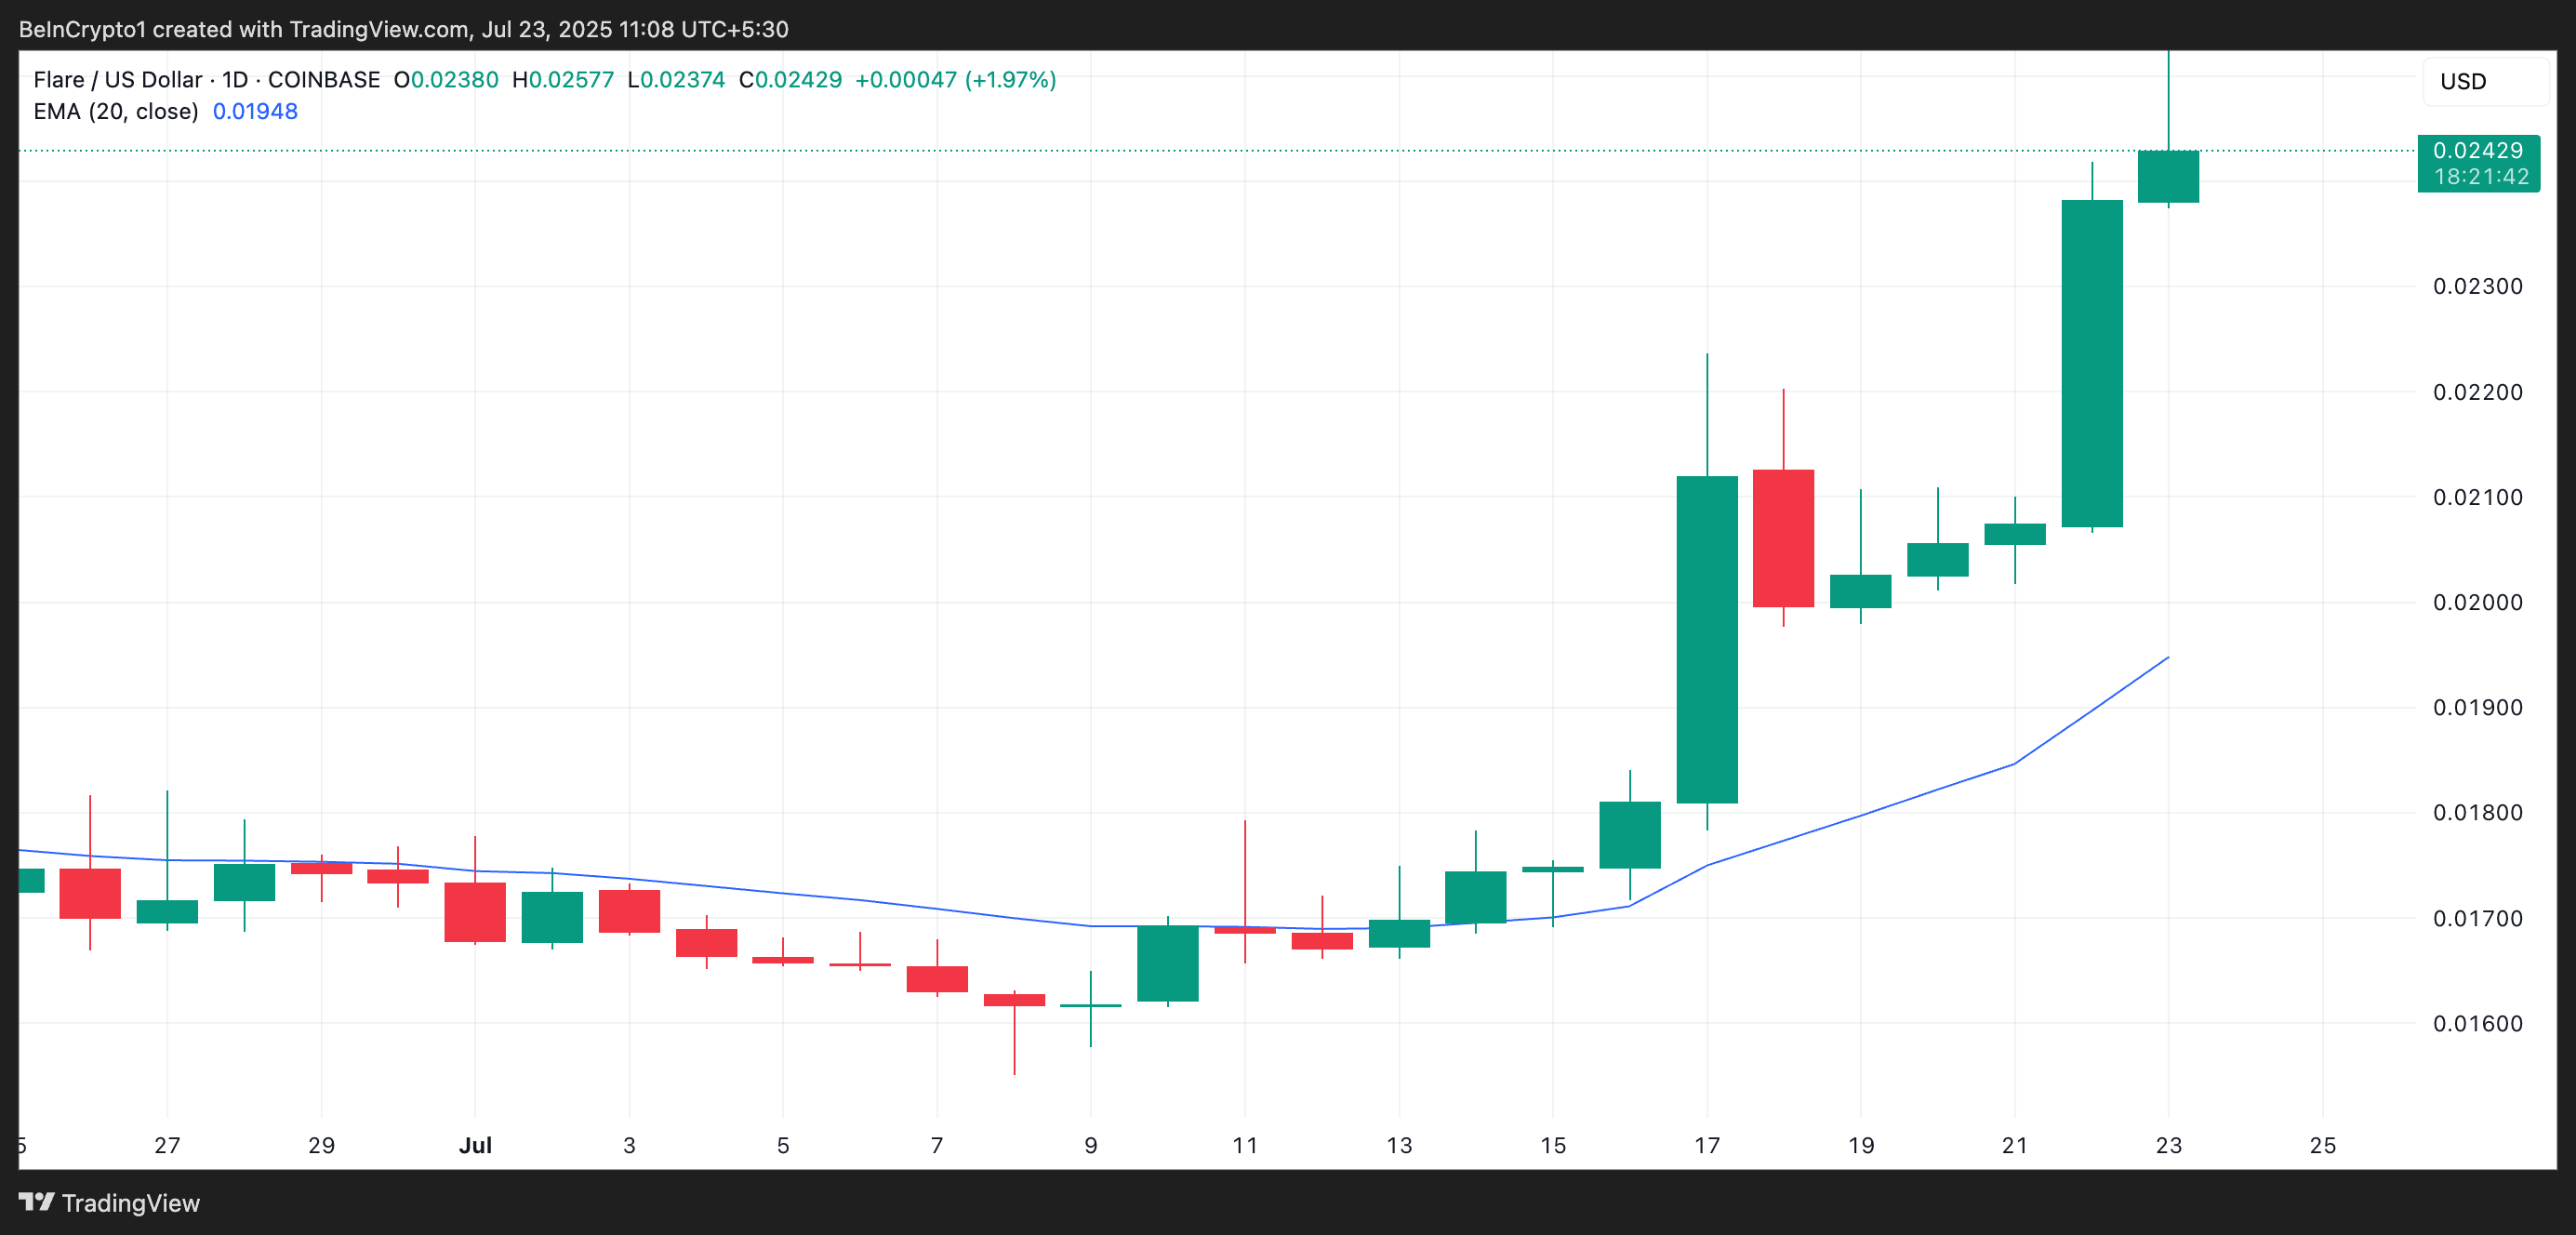
The 20-day EMA measures an asset’s average price over the past 20 trading days, giving more weight to recent prices. When an asset’s price trades above this key moving average, it indicates short-term bullish momentum and suggests that buyers are in control.
Traders interpret this as an indicator for sustainable growth, particularly when paired with rising volume and price, as with FLR.
FLR Charts Path to $0.02798
On the FLR/USD one-day chart, the token is currently testing resistance at $0.02471. If buying pressure intensifies and bulls manage to flip this level into support, FLR could extend its rally toward the next major target at $0.02798.
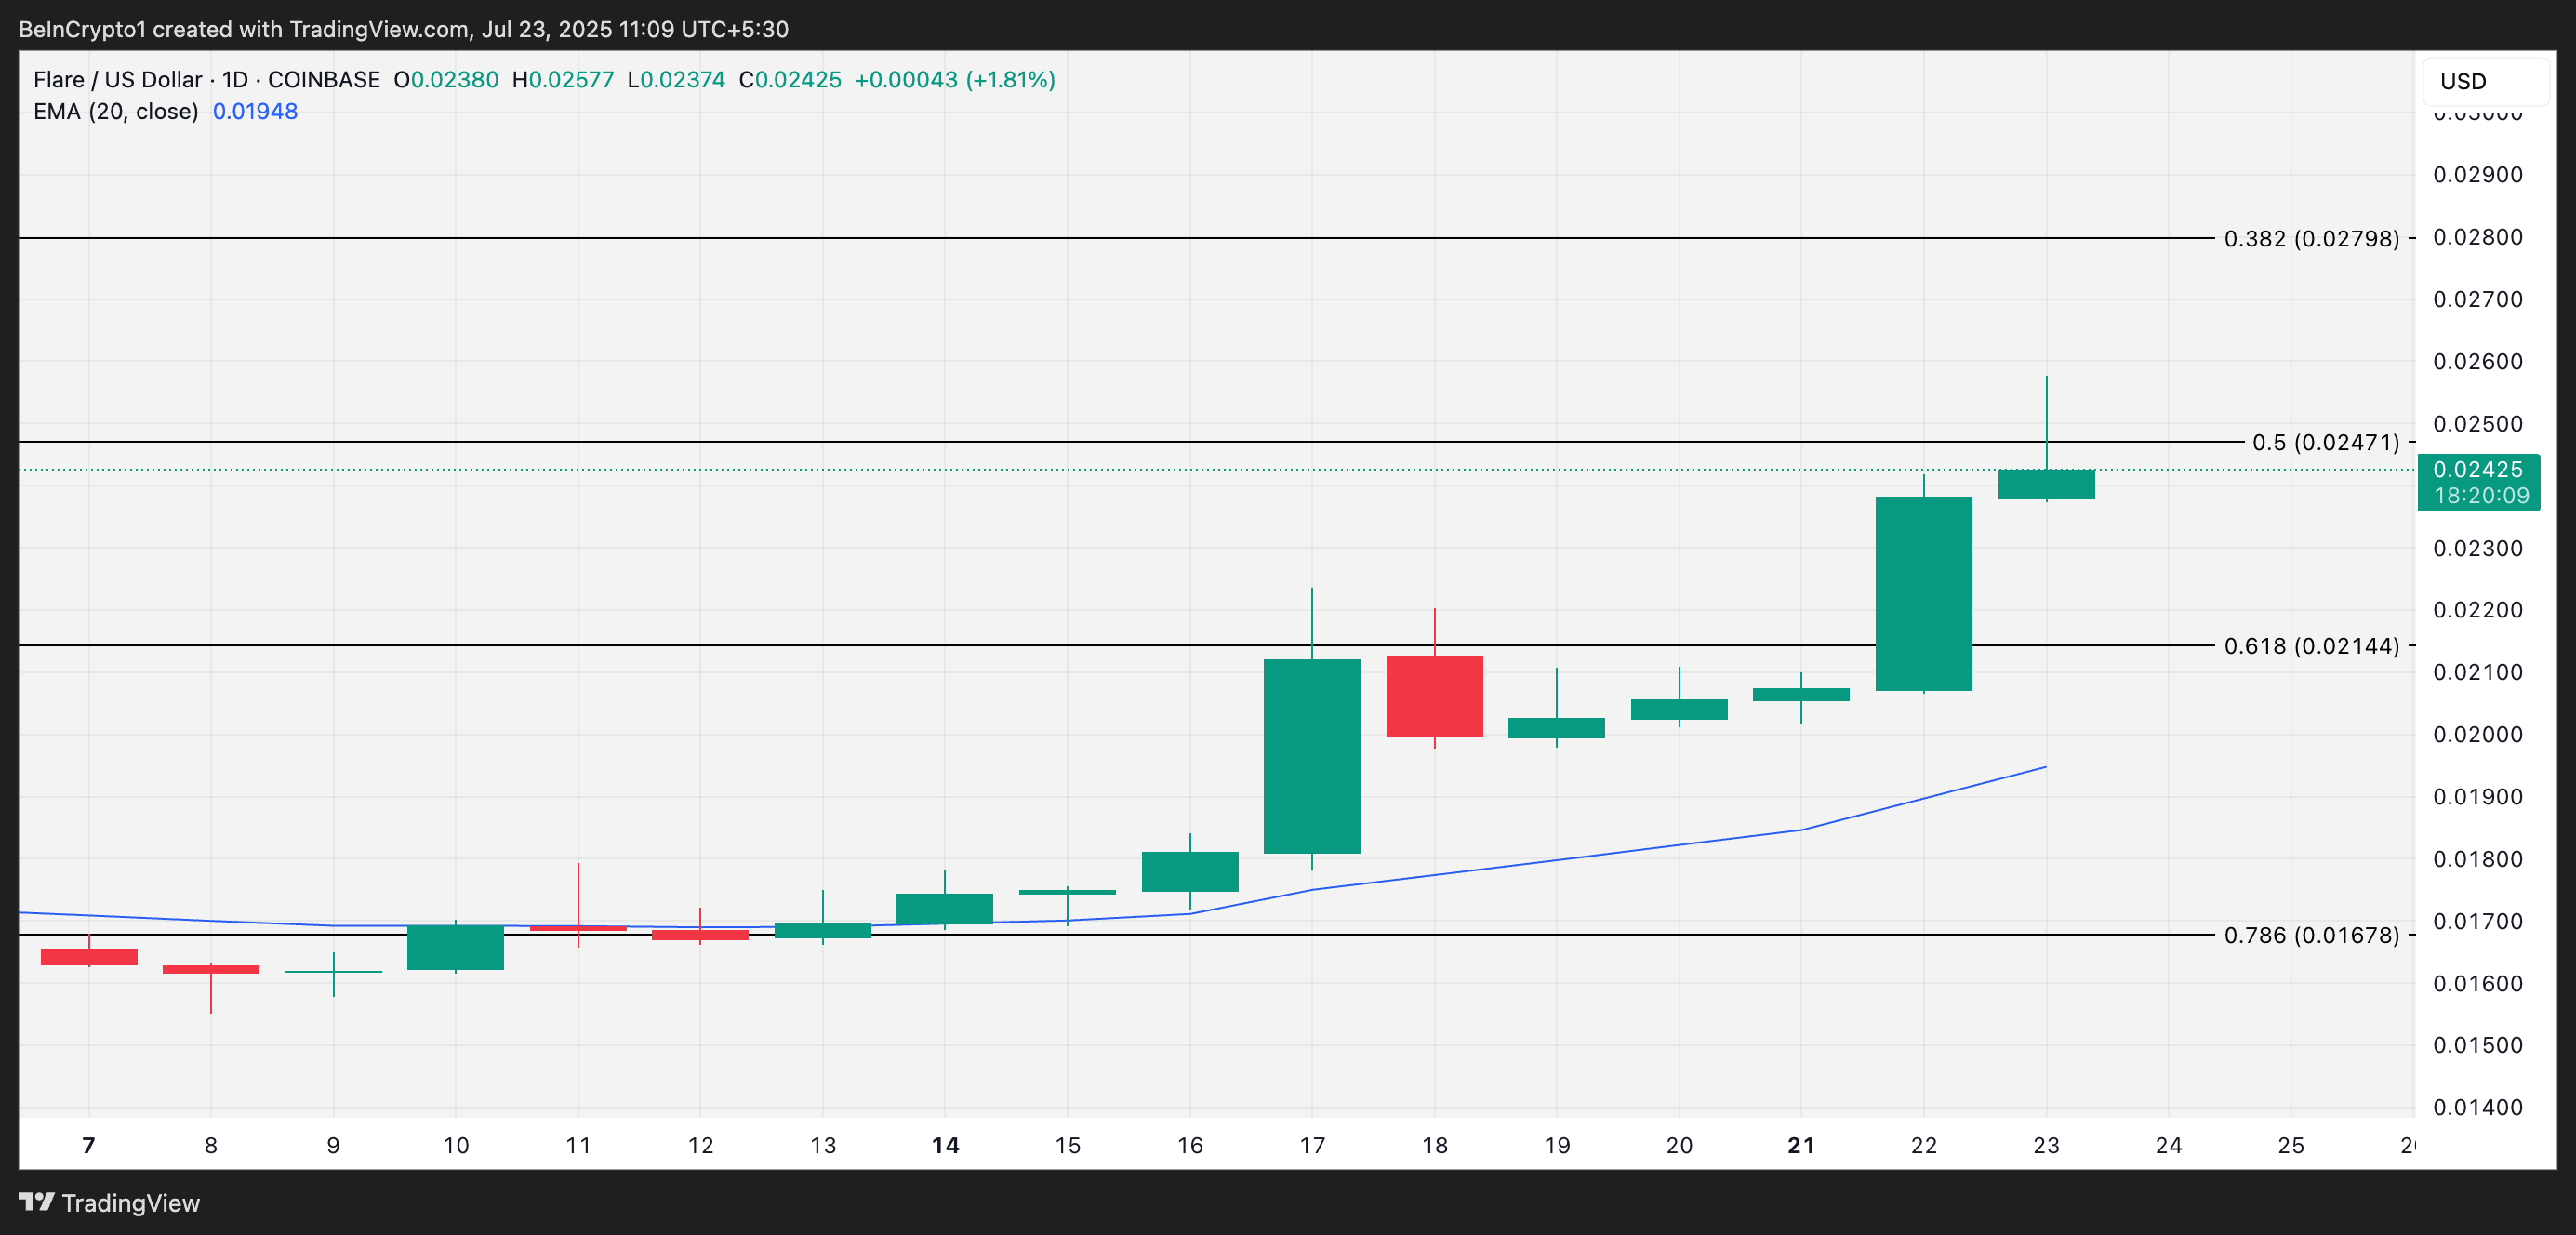
However, any spike in profit-taking could invalidate this bullish setup. A rejection at current levels might send the price back to $0.02144, a critical support zone. If that floor fails to hold, FLR may retreat further toward its 20-day EMA, where it could attempt to stabilize and regain momentum.
