XRP Regime Check: What On-Chain Data Reveals About the Next Move

XRP's on-chain metrics flash conflicting signals—here's what the blockchain whispers while traders shout.
The Whale Watch: Accumulation or Distribution?
Large-holder wallets show subtle shifts in balance. Some addresses load up during dips, others take profits near resistance levels. The smart money isn't moving in unison, creating a tug-of-war beneath the price charts.
Network Pulse: Are Fundamentals Keeping Pace?
Transaction counts and active addresses paint a picture of steady, if unspectacular, utility. It's not the explosive growth of a meme coin frenzy—more like the steady hum of infrastructure being used, a reality check for those expecting parabolic moves without adoption.
Liquidity Layers: Where's the Real Support?
On-chain order book analysis reveals where buy walls cluster and where sell pressure lurks. Key levels emerge not from lines on a trader's screen, but from actual token holdings waiting on the ledger. These are the battlegrounds for the next price swing.
The Sentiment Gauge: Fear, Greed, or Apathy?
Derivatives data and exchange flow metrics hint at market mood. Is capital fleeing to stablecoins, or are leveraged bets piling on? Sometimes the most telling signal is whether the crowd is even paying attention—a cynic might note that in crypto, boredom often precedes the most expensive surprises.
The ledger doesn't lie, but it rarely shouts a single, clear directive. For XRP, the data suggests a regime of consolidation and quiet repositioning, not a breakout or breakdown. The infrastructure is being stress-tested, not just speculated on. Whether that's a foundation for a rally or just efficient sideways action depends on your timeframe—and your tolerance for narratives that move slower than a hedge fund's compliance department.
XRP Selling Pressure Intensifies
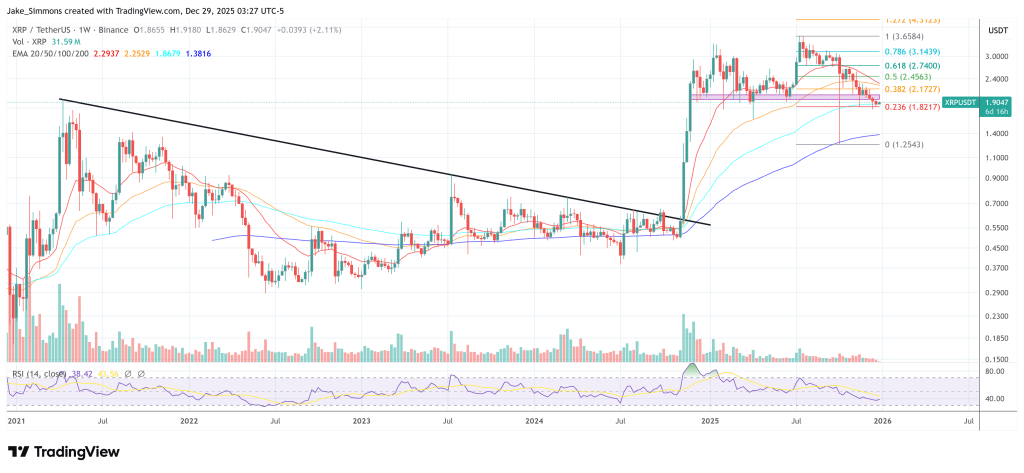
In an X post, Darkfost wrote that “recent data point to a clear intensification of selling pressure on XRP,” placing it in the context of a sharp drawdown. “This dynamic comes in the context of a sharp correction, with the price dropping by around 50%, falling from a peak NEAR $3.66 to an area around $1.85,” he said.
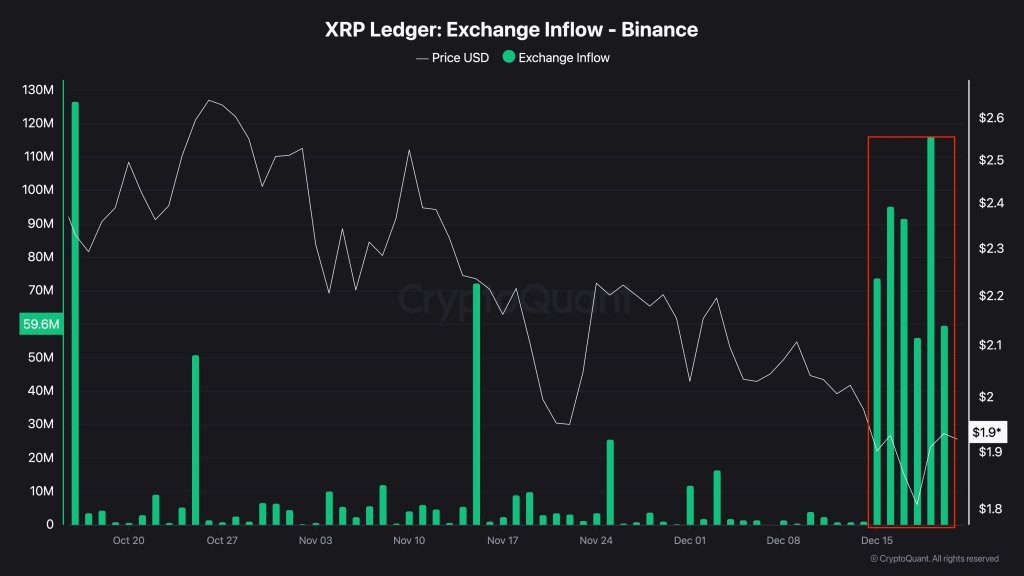
Darkfost’s main signal is exchange inflows, with an emphasis on Binance, which he called the venue that “continues to concentrate the largest trading volumes among all exchanges.” The underlying idea is simple but often effective: when inflows ramp up quickly, the market is seeing more coins positioned where they can be sold.
“One way to visualize this selling pressure is by analyzing XRP inflows to exchanges, particularly Binance,” he wrote. “These inflows are generally interpreted as a potential intent to sell, especially when they increase rapidly.”
He described the shift as starting mid-month. “After a relatively calm period marked by moderate and stable inflows, the situation shifted noticeably starting on December 15,” he said. “Since then, XRP inflows to Binance have risen sharply, with daily volumes ranging from 35 million XRP to a significant peak of 116 million XRP recorded on December 19.”
The implication is less about a single spike and more about the persistence of elevated prints. In that framing, repeated large inflows during a drawdown tend to read like ongoing distribution rather than a clean washout.
Darkfost argued the inflow regime also maps to a behavioral change across cohorts. “This change in dynamics also suggests a shift in investor behavior,” he wrote. “While a large portion of the market had been following a holding strategy since October, the trend over the past two weeks points to a MOVE toward profit taking for older positions, as well as capitulation and loss selling from more recent entrants.”
He was explicit about what WOULD need to change before “accumulation” becomes a defensible label. “As long as these elevated inflows persist or intensify further, it will be difficult for XRP to establish a true accumulation phase,” he said. “If this selling pressure continues, the current correction could not only extend in time but also deepen further.”
The Macro Backdrop
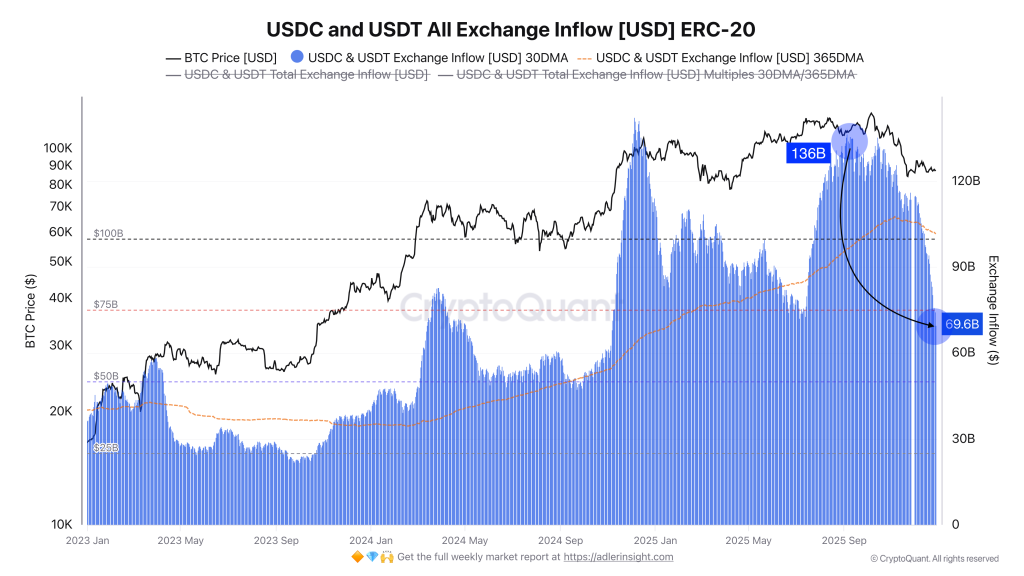
In separate posts, Darkfost tied the XRP signal to a wider market condition he characterized as liquidity constrained. “The crypto market continues to suffer from a lack of liquidity,” he wrote, adding that “the market cap of the main stablecoins has been stagnating for the past few weeks.”
He offered a specific interpretation of what that means for marginal demand. “There is no longer any fresh liquidity entering the market (fiat → crypto),” he said, while also arguing that “liquidity is still present within the market and is not leaving it.” The catch, in his view, is that available liquidity is staying sidelined: “However, this liquidity is not being deployed either, if we look at current stablecoin inflows to exchanges.”
Darkfost quantified the slowdown using exchange inflow averages. “Between September and today, the average monthly inflow to exchanges has been cut in half, dropping from $136B to around $70B,” he wrote, adding that “the annual average has also started to decline over the past few weeks.”
Darkfost also said sentiment in the entire crypto market has swung negative, based on a composite he tracks. “The general consensus has turned bearish,” he wrote, saying the indicator is “based on media articles, data from X, and several other sentiment indicators.” He noted that “when a shared consensus forms, the market tends to reverse and prove the majority wrong,” citing similar setups he observed between July and October 2024 and between February and April 2025.
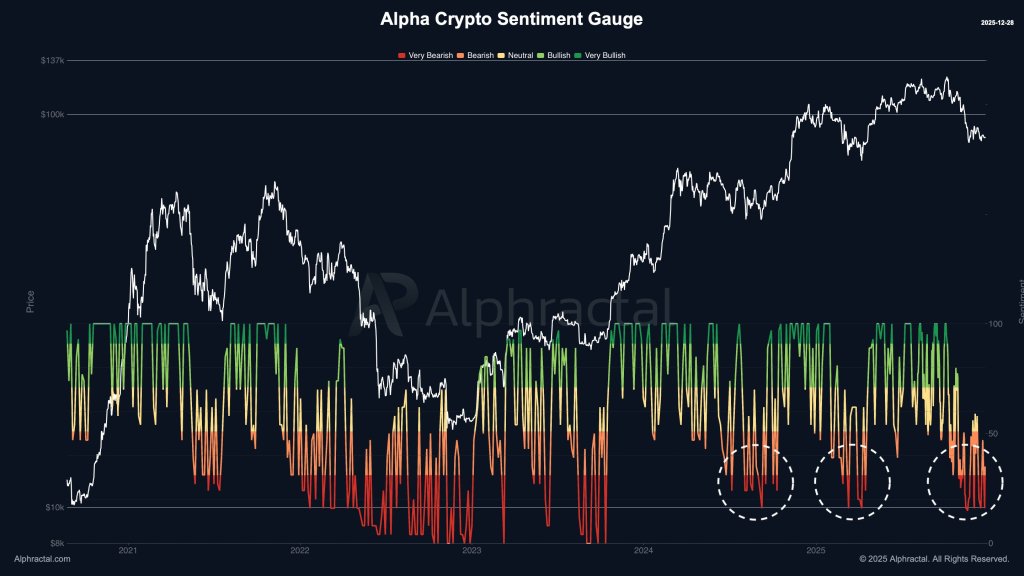
At the same time, he warned against treating the signal as a timing tool, especially if broader conditions deteriorate. “These phases can last for some time, especially when the market enters a prolonged bear market phase,” he wrote. “We have only started to enter this period since early November, so there is no need to rush, but it is probably already a bit late to turn bearish.”
At press time, XRP traded at $1.90.