Binance Liquidity Structure Echoes Bitcoin’s Pre-Rally Blueprint – Here’s What It Means

Liquidity patterns on major exchanges don't lie—they whisper the market's next move. Right now, Binance's order book is flashing a familiar signal, one that historically precedes significant Bitcoin uptrends.
The Ghost of Rallies Past
Market analysts are pointing to a specific configuration in Binance's liquidity pools. It's not about the raw volume; it's about the structure. The distribution of buy and sell orders, the depth at key price levels—it's all mirroring formations seen before previous parabolic breaks. Think of it as the market's muscle memory kicking in.
Beyond the Order Book
This isn't just chart voodoo. This structural echo suggests a critical accumulation phase. Large players are positioning, creating a liquidity framework that typically either fuels a powerful breakout or establishes a formidable floor. It indicates a shift in market participant psychology from reactive trading to strategic positioning.
The Cynical Take
Of course, in crypto, every pattern is a promise until it's a pitfall—remember, past performance is the favorite bedtime story of every fund manager trying to justify their fees.
The setup is clear. When liquidity structures align with historical precedent, it often means the smart money has already placed its bets. The only question left is timing. For traders, it's a call to heightened vigilance; for the market, it might just be the prelude.
Stablecoin Reserves Suggest Latent Buying Power
Darkfost’s analysis highlights an important nuance behind Bitcoin’s recent rebound. Although BTC has rallied roughly $8,000 over the past week—supported by a NEAR $4 billion expansion in open interest—the Bitcoin-to-stablecoin ratio on Binance continues to send a notably constructive signal. In previous cycles, sharp price recoveries were often accompanied by an immediate drawdown in stablecoin reserves. That is not what is happening now.’

A similar setup last appeared during the March 2025 correction, when Bitcoin fell from $109,000 to $74,000. At that time, the ratio remained compressed before reversing higher, a MOVE that preceded a strong expansion phase and a push toward new all-time highs near $126,000. The current structure closely resembles that period.
At present, the ratio is still hovering around the 1 level following a pronounced contraction. This implies that stablecoins account for a relatively large share of exchange balances. Data shows that stablecoin reserves grew by roughly $1 billion as prices fell, either through defensive positioning or fresh capital entering the platform. Meanwhile, Bitcoin’s USD value declined, mechanically increasing the purchasing power of those reserves.
What stands out now is the early turn higher in the ratio. If sustained, this shift may signal the gradual deployment of sidelined liquidity rather than speculative exhaustion. In practical terms, it suggests that the market may be transitioning from capital preservation to selective risk re-engagement, a dynamic that often supports further upside if price structure confirms.
Bitcoin Attempts Recovery Below Key Moving Averages
Bitcoin is currently trading near the $93,800 level after bouncing from December lows around the mid-$80,000s, signaling a short-term relief phase following weeks of heavy selling pressure. The chart shows a clear rebound from the local bottom, with price reclaiming horizontal support near $92,000–$93,000, an area that previously acted as resistance during the breakdown. This level now represents a critical pivot for market structure in the near term.
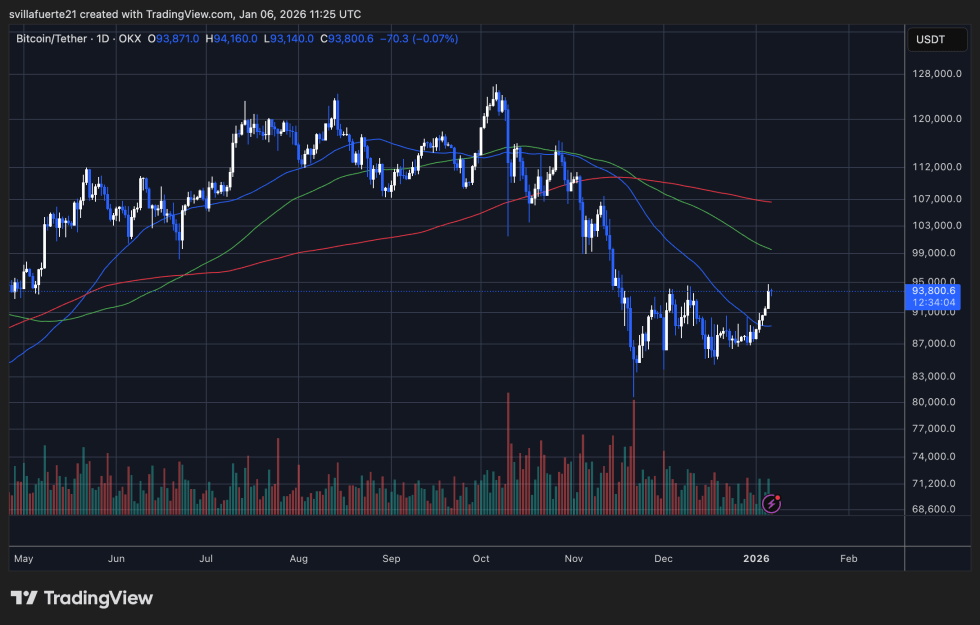
Despite the recovery, Bitcoin remains below its declining short-term and mid-term moving averages. The blue moving average (short-term) is still sloping downward and acting as immediate dynamic resistance, while the green and red longer-term averages remain overhead, reinforcing a broader corrective structure.
Until price can reclaim and hold above these levels—particularly the zone between $97,000 and $100,000—the move should be viewed as corrective rather than trend-confirming.
While selling pressure has eased compared to the capitulation phase seen in late November and early December, the rebound has not been accompanied by a decisive surge in volume. This suggests that buyers are selective rather than aggressive, consistent with a market in stabilization rather than expansion.
Structurally, Bitcoin is forming a short-term higher low, which reduces immediate downside risk. However, the broader trend remains vulnerable. A failure to hold above $92,000 could reopen the path toward range continuation, while a clean break above the descending moving averages WOULD be required to shift momentum decisively back in favor of the bulls.
Featured image from ChatGPT, chart from TradingView.com
