Ethereum’s $4,000 Barrier Holds Strong: Fourth Rejection Sparks Market Jitters

Ethereum bulls just got stonewalled—again. The $4,000 resistance level rejected price action for the fourth time this quarter, leaving traders wondering if the 'flippening' is stuck in neutral.
Key pressure points:
- Liquidity crunch: Each rejection tightens the spring—but which way will it snap?
- Derivative markets show whales are hedging bets, with open interest lagging behind last cycle's ATH chase.
Meanwhile, Bitcoin maximalists are (predictably) crowing about store-of-value superiority—as if their own 18-month sideways action never happened. The real story? Institutional money's still playing both sides until the SEC stops treating crypto like a Whac-A-Mole game.
Next 48 hours could see either a breakout fueled by spot ETF whispers or a retreat to $3,600 support. Either way, grab popcorn—this resistance battle's becoming must-watch TV.

- Ethereum struggles at $4,000 resistance for the fourth time, facing consistent selling pressure.
- Daily price gains contrast with declining 24-hour trading volume, indicating cautious momentum.
- MACD shows bearish signs, but RSI suggests ongoing buying interest below overbought levels.
Ethereum (ETH) has faced resistance at the $4,000 mark for the fourth time, according to the weekly price chart dated August 6, 2025. This repeated inability to cross the $4,000 level has impacted price movements over the past year. After reaching this key resistance zone, the token has declined on multiple occasions, indicating ongoing selling pressure around this price point.
Ethereum $ETH: 4 consecutive rejections!
What happens next? pic.twitter.com/SYBOTMcbkT
Since late 2023, the $4,000 level has served as a major barrier preventing ethereum from recording gains above this mark. The latest peak in early August 2025 saw ETH approach this resistance but retreat to approximately $3,611, following a pattern similar to the previous three peaks.
Two primary support levels have been noted below this resistance. Around $2,450, Ethereum found support multiple times during 2024 and early 2025, acting as a key point for consolidation and price reversals. A lower support level near $1,575 formed during the market correction in mid-2025, where Ethereum saw a rally.
Current Price Movement and Market Indicators
At the time of writing, Ethereum was trading at $3,728.25, marking a daily gain of 2.84%. This upward movement has led to a market capitalization of roughly $450 billion. Despite this price increase, the 24-hour trading volume has declined by over 15% to $26.51 billion, showing reduced market activity compared to earlier sessions.
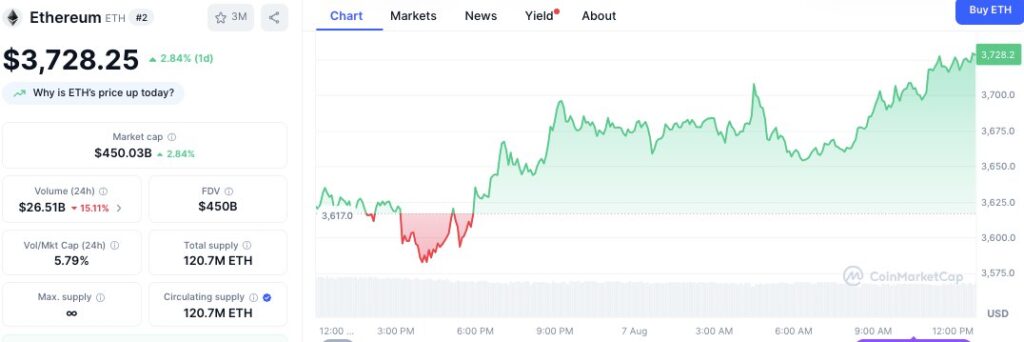
Intraday price action shows that Ethereum opened NEAR $3,617, recording a midday decline, but rebounded to exceed $3,720 by midday on August 7. The total and circulating supply of Ethereum remains at 120.7 million ETH, with no changes to the maximum supply, which remains unlimited.
Technical Indicators Signal Mixed Momentum
The Moving Average Convergence Divergence (MCD) is showing bearish momentum at the moment. The MACD line is 142.04 lower than the signal line, 183.31, with the MACD histogram having negative values of -41.26. This indicates higher short-term selling pressure. However, the increasing separation between MACD and the signal line may indicate a bullish reversal should the interest to buy gain strength, which may suggest a change in momentum towards bullish.
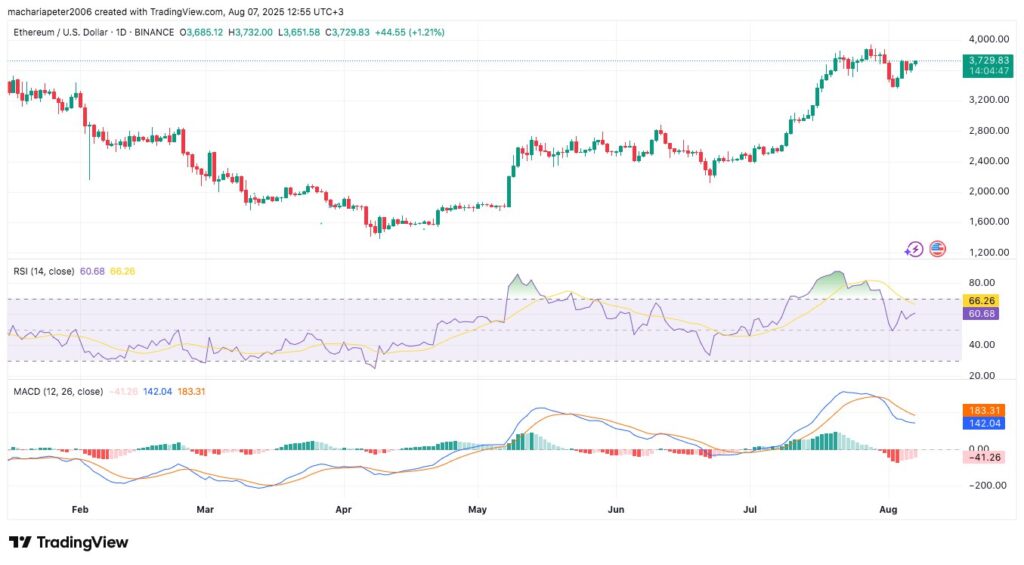
Meanwhile, the Relative Strength Index (RSI) is at 60.68, below a recent peak of 66.26 but above the neutral midpoint of 50. This level signals a strong buying trend without nearing the overbought threshold of 70.
