Sui Price Surges Toward $2: Market Structure Screams ’Perfect Timing’ for Entry

Market structure just flashed a massive green light for Sui.
Technical patterns are aligning in a near-perfect bullish formation, pushing the asset toward the psychological $2 barrier. Analysts point to a confluence of support levels and momentum indicators that suggest this isn't just another pump—it's a structural move.
The Setup Everyone Missed
While retail traders were distracted by memecoin mania, Sui's chart was quietly printing a textbook breakout pattern. The key resistance levels that capped gains for weeks have now flipped to support. Volume confirms the move; it's not just speculative air.
Why $2 Matters More Than You Think
Breaking and holding above $2 isn't just a nice round number. It represents a critical validation of the network's underlying growth narrative—a level that could trigger a wave of institutional re-rating and algorithmic buying. Forget the hype; the tape tells the story.
Of course, in crypto, 'perfect timing' often means 'right before the whales decide to take profits'—but for once, the charts and the clock might actually be in sync. The window looks open. For how long? That's the multi-million dollar question.
Why Is Sui Price Going Up Today: 17% In a Day, and 37% Weekly Surge
At the time of writing, the asset holds a market cap of $7.48 billion, while its 24-hour trading volume has surged to $1.79 billion as seen in the official CoinMarketCap chart, marking an increase of about 97.65%.
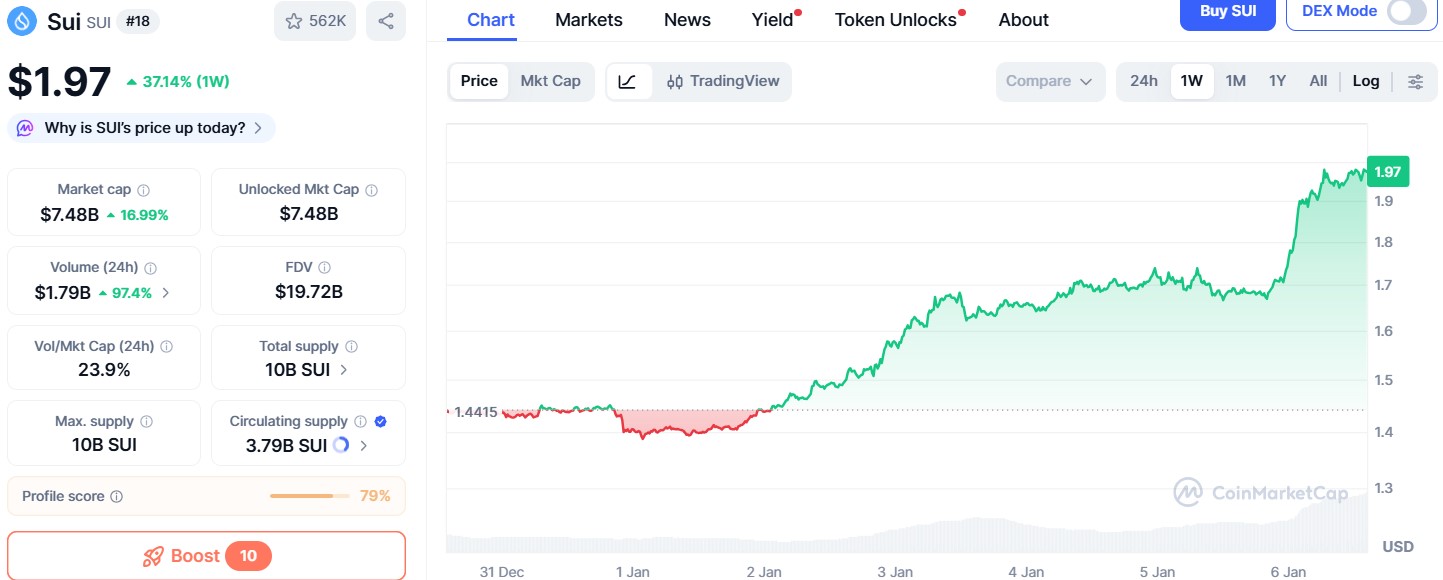
This sharp rise holds one of the strongest fundamental sui price surge reasons: “Private transactions for everyone.”
The official team on X reposted an update from Kostas Kryptos, co-founder of Mysten Labs. According to the post, Mysten Labs, George Mason University, and Yale released a huge study on how to make crypto transactions private and safe.
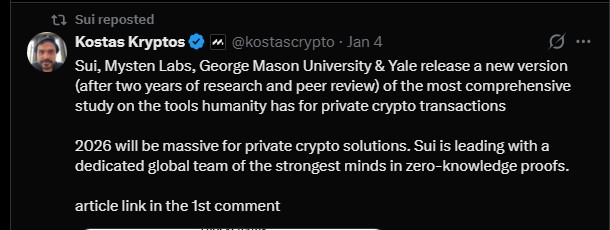
Kryptos said that 2026 could be a big year for private crypto technology and that the this network is ahead of others because it has a strong global team working on zero-knowledge proofs. This latest sui news made people more confident and helped push the price higher over the past week.
Technical Price Chart Analysis: The "Bullish" Signs
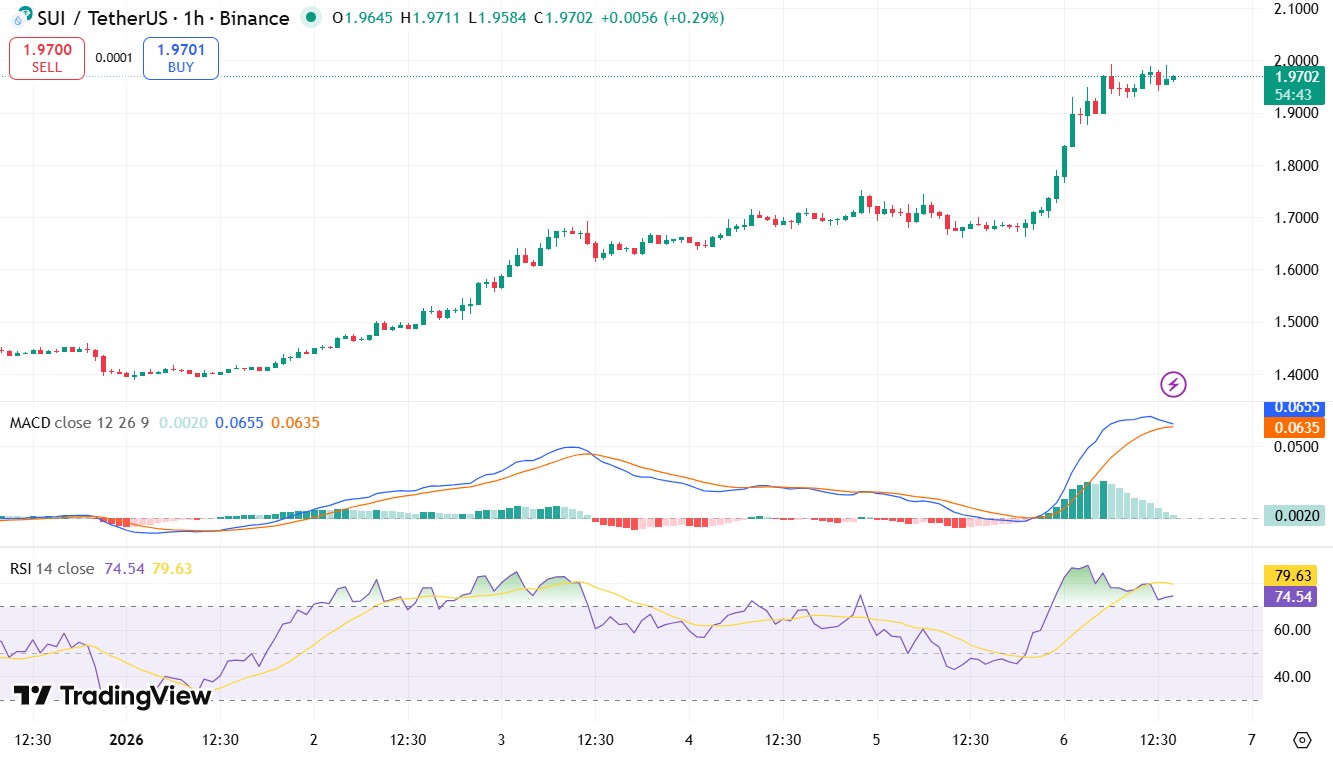
When we look at the TradingView price chart, the SUI price going up looks very strong and healthy. It isn't just a "fake" rise; it’s a "breakout."
-
Breaking the Ceiling: The asset broke through its "resistance" level of $1.85, which is also the new support zone of the token.
-
Momentum (RSI): The RSI is around 74. This means there is a lot of "buying power" behind the move.
-
The "MACD" Cross: The bars are growing taller and greener, which shows that more buyers are entering the market.
Key Metrics For Traders:
Immediate support lies between $1.85 and $1.90.
The resistance zone is around $2.05–$2.10.
As long as it holds above $1.85 level, the technical structure remains bullish, with a target of $2.10 or higher likely.
Price Prediction 2026: Is The Rally Real and What Next?
Top market analysts are very excited about the potential Sui 2026 breakout scenario, because the crypto market has added $260,000,000,000 to its market cap in the first 5 days of 2026.
This huge liquidity injection is one of the strongest reasons why we might be entering a "Moon Phase" or Altseason.
In the short term (next 2–4 weeks), the price could MOVE up toward $2.10–$2.35 if the market stays strong.
Looking at the mid-term outlook, good market conditions could push the SUI price prediction 2026 around $2.80–$3.50. But if the momentum slows down, the price could drop to $1.40–$1.65 range.
For the long term, if a strong altseason 2026 happens, the SUI price going up trend could reach $5–$7 or more.
Altseason 2026: Why Market Structure Supports The Project
Many traders are now wondering if altseason will finally come this year, and past cycles suggest it is possible. Right now, ALT/BTC has been falling for almost four years. Its RSI is at the most oversold level ever, and the MACD has just turned green after 21 months, which often signals a trend change.
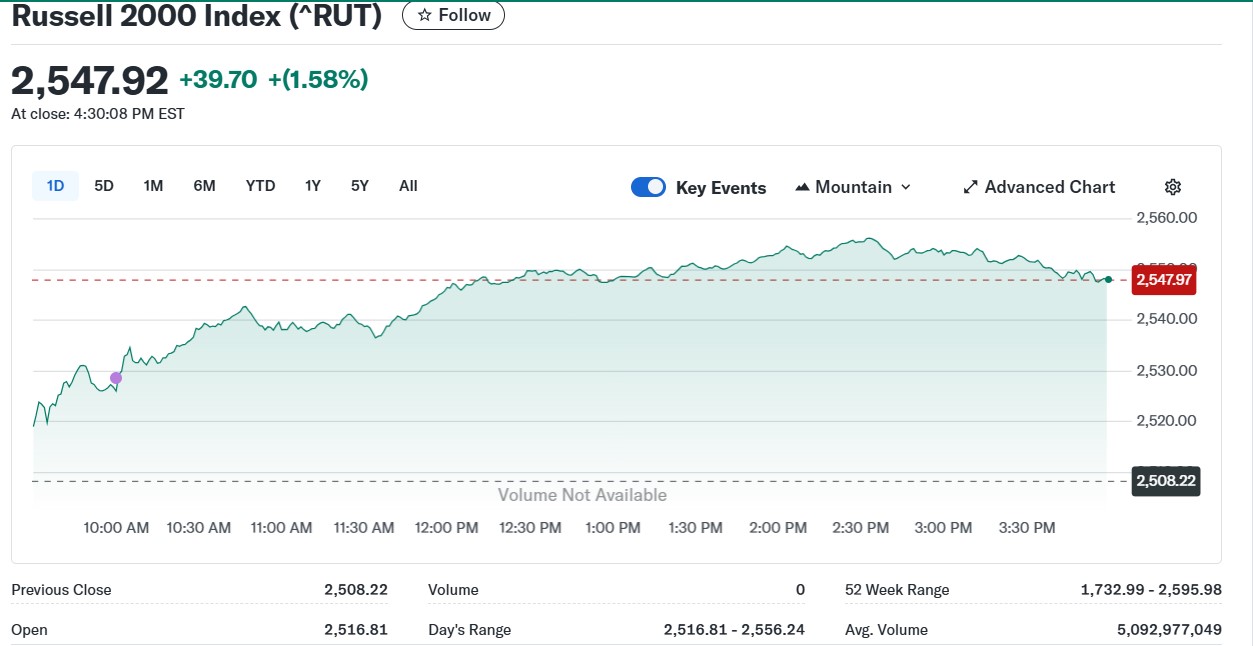
This market structure is very similar to previous early-season rallies. Stock markets also support this idea. The Russell 2000 index, which shows how much risk investors are willing to take, has broken out NEAR its old highs of 2,595.98, as seen in the above chart.
In both 2016 and 2020, altcoins started rising only after ALT/BTC hit a bottom and broke its downtrend, and then altcoins went on to outperform Bitcoin.
This time, the breakout came in Q4 2025, suggesting the cycle may be delayed, but not cancelled. History shows that if altseason starts, SUI price going up trend usually follow them up.
Conclusion
The Sui price going up today isn't just a lucky break; it is backed by strong fundamentals, rising volume, clean technical structure, and improving macro conditions.
While short-term volatility is expected, altseason arrival will define the token’s long term momentum.
YMYL Disclaimer: Investing in cryptocurrencies is very risky, as prices fluctuate quickly. This article is for news purposes only and is not financial advice. Always talk to a professional and do your own research before investing.
