Bitcoin Breaks Below $90,000 as Traders Spot Repeating Pivot Pattern—Stocks Rally, Crypto Stalls

Bitcoin just sliced through a key psychological level, and the usual market correlations have gone out the window.
While traditional equities enjoyed a green day, the flagship cryptocurrency took a dive below $90,000. This divergence has traders scrambling, but seasoned chart watchers aren't panicking—they're pointing to a familiar technical formation playing out on the charts.
The Pivot Pattern Repeats
Market veterans have seen this movie before. The current price action mirrors a classic pivot pattern that has historically preceded significant directional moves. It's a dance of support and resistance that algorithmic traders feast on, and right now, the algos are leaning bearish on BTC.
This isn't about weak fundamentals or a crisis of faith. It's pure, cold-blooded technicals playing their hand. The pattern suggests a consolidation phase, a battle between bulls and bears where the next major breakout—up or down—gets its marching orders.
A Cynical Take on Correlation
So much for "digital gold" acting as a hedge. Today's action is a fresh reminder that in the short term, crypto often marches to its own volatile beat, leaving traditional portfolio theories looking as useful as a paper umbrella in a hurricane. Sometimes, the only thing it hedges against is boredom.
The key takeaway? Watch the pivots, not the headlines. This pattern has dictated Bitcoin's rhythm before, and it's setting the tempo again. The break below $90,000 isn't an endpoint; it's a new data point in a much older, repeating equation.

Bitcoin surprised the entire market today after falling sharply below $90,000, dropping 6%, triggering more than $340.6 million in long liquidations.
What confused traders is that this fall occurred without any bad news or major event. At the same time, the Nasdaq, Silver, and the S&P 500 all moved up, while BTC struggled.
Silver, S&P 500 Rise, Bitcoin Falls 6%
This is the first time in almost ten years that Bitcoin has moved down, while Silver and the S&P 500 went up, but Bitcoin dropped 6%. This is unusual because, for almost 10 years, Bitcoin has mostly moved in the same direction as major markets.
Many traders say this strange price MOVE often means big players are moving the market on purpose, trying to trigger liquidations on both long and short positions.
Trader Spots a Pattern Around FOMC Pivot Dates
Crypto trader KillaXBT says bitcoin is still following the same pattern it has shown after every recent FOMC (Federal Reserve) week.
After the latest pivot, Bitcoin first rose above $95,000, but then fell by around 5%, and is now NEAR $90,000. He believes the next important moment will come around December 10–11, when Bitcoin may again drop by 5–7%, just like before.
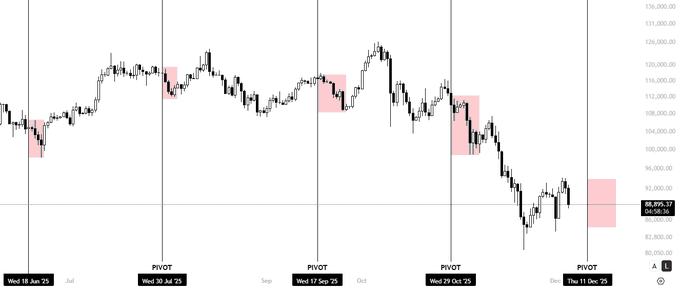
Right now, the most important support area is around $87,000–$88,000. This level has held up many times, and strong ETF buying and halving excitement could help protect Bitcoin from falling too deep.
But if the same pattern repeats, Bitcoin might dip again toward $83,000.
Bearish Sentiment Grows: “The Bottom Isn’t In Yet”
Meanwhile, several analysts still expect more downside. A popular chart analyst, Ali Martinez, also pointed out another worrying sign, Bitcoin has dropped below its 730-day simple moving average (SMA), a level that has often marked the start of long bearish periods in the past.
This important support is around $82,150, and if Bitcoin closes below it, the charts may turn even more negative. A deeper breakdown could push the price toward the $76,000 zone next.
Extended downtrends often begin when Bitcoin $BTC falls below its 730-day SMA.
That level is $82,150 right now! pic.twitter.com/fa1JFX7orR
Adding to this, another crypto trader, Doctor Profit, said the market is still acting like a bear market and may continue this way until 2026. He believes Bitcoin could drop further and is still holding his short position from the $120,000 level, expecting more downside before any real recovery begins.
Bitcoin ETF Inflow Signal Bullish Hope
The market isn’t entirely negative, there are still some encouraging signs. The state of Texas invested $5 million into a Bitcoin ETF.
Many traders are anticipating rate cuts next year, and ETF inflows remain strong, with Bitcoin ETFs recording an inflow of $54.8 million on December 5.
As of now, Bitcoin is trading around $89,551, down 2% in the last 24 hours. The December 10–11 pivot will be crucial in determining whether this is another drop or the start of a real bottom.
