Solana (SOL) Stalls Below $130 While Bitcoin & Ethereum Hold Ground—What’s Next for 2026?

Solana's price action hits a wall as the broader crypto market catches its breath. With Bitcoin and Ethereum consolidating, all eyes turn to what 2026 might bring for the high-speed blockchain.
The Consolidation Phase
Major cryptocurrencies aren't crashing—they're just pausing. This period of sideways movement often precedes the next big leg up, a pattern veteran traders know all too well. The lack of panic selling suggests institutional money is staying put, waiting for the next catalyst.
Solana's Technical Picture
Holding below the $130 level creates a clear line in the sand. A sustained break above this resistance could trigger algorithmic buying and renewed retail FOMO. Until then, the network's blistering transaction speeds and growing developer activity provide fundamental support that technical charts can't capture.
The 2026 Horizon
Next year brings more than just another digit change. Regulatory clarity should finally emerge from the political fog, potentially unlocking trillions in traditional finance capital. Scalability solutions moving from testnets to mainnets could make today's congestion issues look quaint. And yes, some over-leveraged hedge fund will probably blow up again—because what's a bull market without a spectacular cautionary tale?
Forget predicting exact prices. Watch adoption metrics, developer migration, and whether real-world applications finally move beyond speculative trading. The technology keeps advancing while Wall Street catches up—usually just in time to take credit for the gains.
As the crypto markets are heading for the yearly close, the volatility has just lit up. Bitcoin price surged over $90,000 for a while but failed to reach the critical resistance at $90,500. As a result, the price dropped below $88,000, dragging the ethereum price below $3000. Besides, Solana price also faced a similar downfall after hitting the psychological barrier at $130 and dropped to $122 to $123 level. Although the price is constantly failing to secure $130, in the broader perspective, the token is preparing for a divine move.
On the other hand, the token had attracted enough attention through inflows and accumulations. Therefore, it would be interesting to watch whether these factors will push the SOL price beyond $150 in early 2026.
Capital Rotation: Fund Flows into Solana
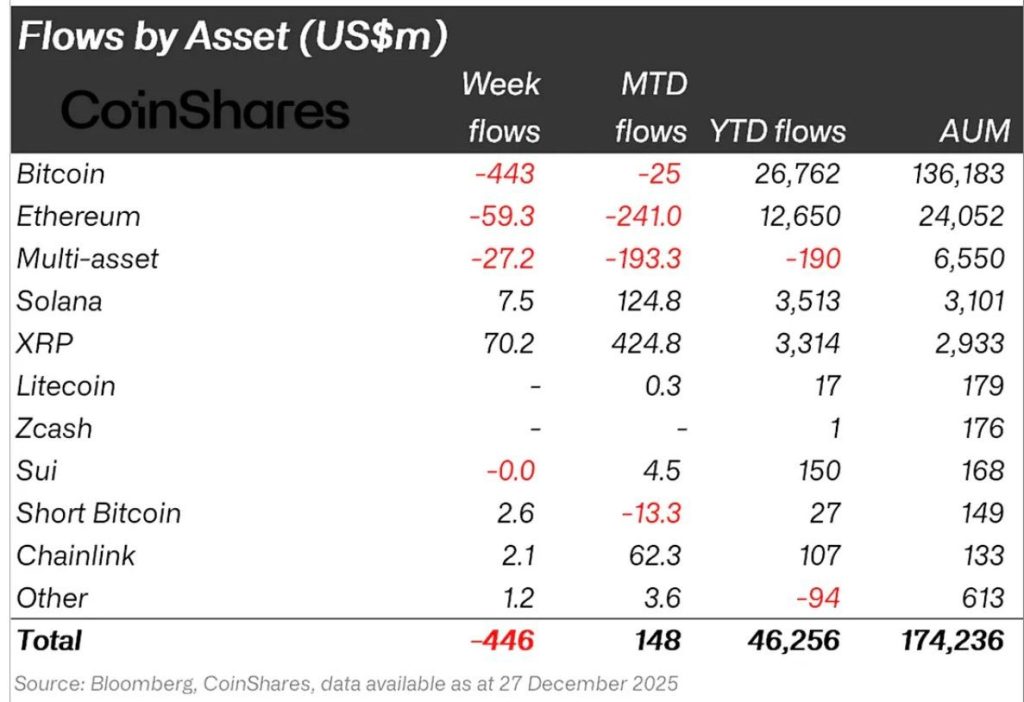
Recent fund-flow data from CoinShares shows a clear divergence. While Bitcoin and ethereum products have experienced net weekly outflows, Solana-linked products recorded a third consecutive week of modest inflows. This does not signal a broad risk-on shift, but it does highlight rotation rather than exit. In late-cycle consolidation phases, capital often seeks assets showing momentum without overcrowding—Solana currently fits that profile.
On-Chain Liquidity: DEX Spot Volume Crosses $2.3T YTD
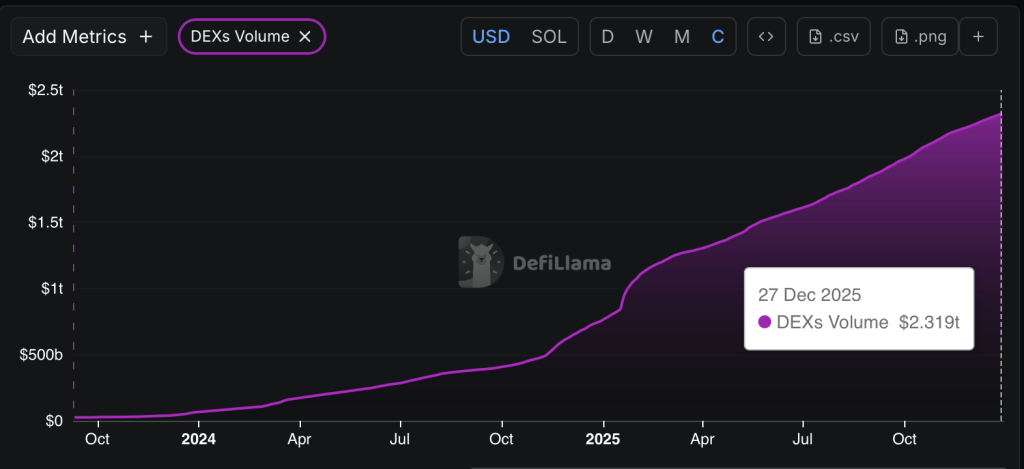
On-chain data reinforces this picture. According to Defilama, aggregate DEX spot volume across Solana-based protocols has crossed $2.3 trillion year-to-date. This reflects cumulative decentralized trading activity rather than a single venue, driven largely by retail participation and memecoin-related flows. While centralized exchanges still dominate total volumes, the scale of on-chain liquidity highlights Solana’s growing role as a major trading hub.
Solana Price Analysis: Weekly Compression at a Make-or-Break Zone
From a technical standpoint, Solana’s weekly chart adds weight to the relative-strength narrative. SOL continues to trade within a large ascending structure, supported by a rising trendline that has held since early 2023. Importantly, price is consolidating just above the 200-week EMA NEAR $121, a level that has repeatedly acted as dynamic support during pullbacks.
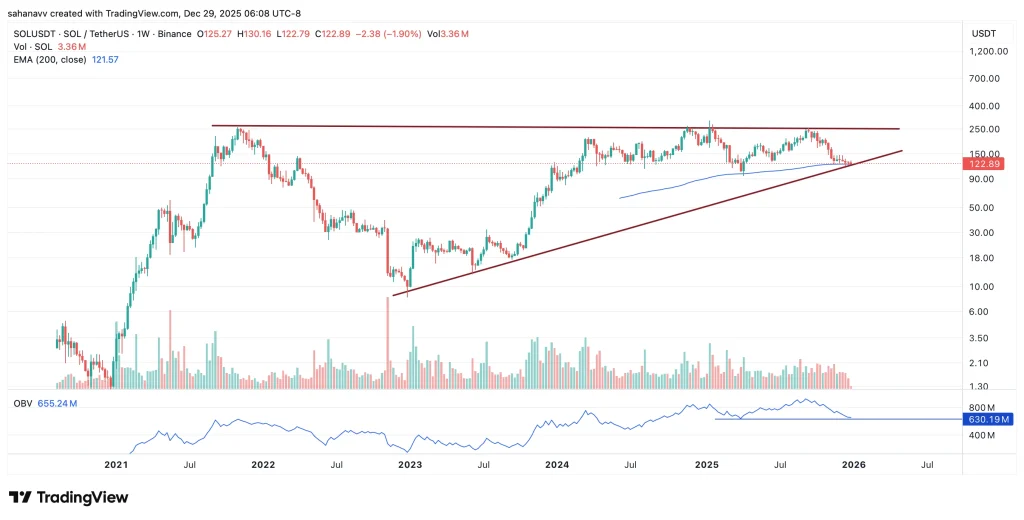
At the same time, SOL faces persistent resistance in the $145–$150 zone, where multiple weekly rejections have occurred. This has created a compression setup, with higher lows pressing into long-term resistance. Volume has remained steady, and OBV is holding near elevated levels, suggesting accumulation rather than distribution.
As long as SOL holds above the rising trendline and the 200-week EMA, the broader structure remains constructive. A weekly close above $150 WOULD confirm a breakout and open the door toward $180–$200. Conversely, a decisive break below $120 would weaken the setup and expose downside toward the $95–$100 support area.
Conclusion: Can Solana Reach $150 in Early 2026?
Whether solana reaches the $150 level in early 2026 will depend less on narrative and more on price confirmation. On the weekly chart, SOL continues to hold above the rising trendline and the 200-week EMA near $120, keeping the broader structure constructive. As long as this support zone holds, downside risk remains contained.
However, $145–$150 remains a major supply zone, where sellers have repeatedly stepped in. A weekly close above $150, followed by acceptance, would mark a structural breakout and significantly improve the probability of continuation toward higher levels. Until that happens, Solana is likely to remain in consolidation. In short, $150 is achievable—but only if price confirms strength, not before.
