GUNZ Coin Finally Breaks Out: First Positive Surge in 6 Months Sparks Bullish Chatter

After half a year of sideways drift, GUNZ Coin is making a move. The digital asset just punched through a key resistance level—its first meaningful breakout since mid-2025. Traders who'd written it off are suddenly paying attention.
What's Behind the Push?
No single catalyst stands out—just the classic crypto cocktail of renewed spot market interest and a dash of futures-led momentum. The charts show a clean break, not a messy spike. Volume confirms the move, suggesting this isn't just another head-fake for the bag-holders.
The Real Test Starts Now
Breaking out is one thing; holding the line is another. The next 72 hours will determine if this is a sustainable trend reversal or just a fleeting pump before the next leg down. Watch for a consolidation above the breakout level—that's the bull case. A swift rejection back into the old range? That's the bear trap.
One cynical fund manager's take: 'It's a breakout, alright. Breaking out of the coma it's been in since summer.' Harsh, but in crypto, sentiment shifts faster than a memecoin rug pull. For now, GUNZ has the momentum. Let's see if it can keep it.

The avalanche-supported blockchain gaming project Gunz (GUN) has finally made a notable move. In a daily frame, this gaming crypto has broken out of a downward channel started in early July 2025.
Gunz coin is a Web3 gaming and in-Game NFT project like the Sanbox, GameFi, and Immutable X. This gaming crypto has surprised everyone with a spike of 20% in 24 hours and a volume surge of 58.48%.
It is also to be noted that the price action of the GUN token is bullish in daily, weekly, two-hour, and hourly charts.
GUN/USDT Daily Shows Good Support
At press time, GUN is at $0.02365 after bouncing from the $0.001215support zone. The price in the daily frame shows moving out of a downward channel with printing resistance at $0.01110 to $0.001215.
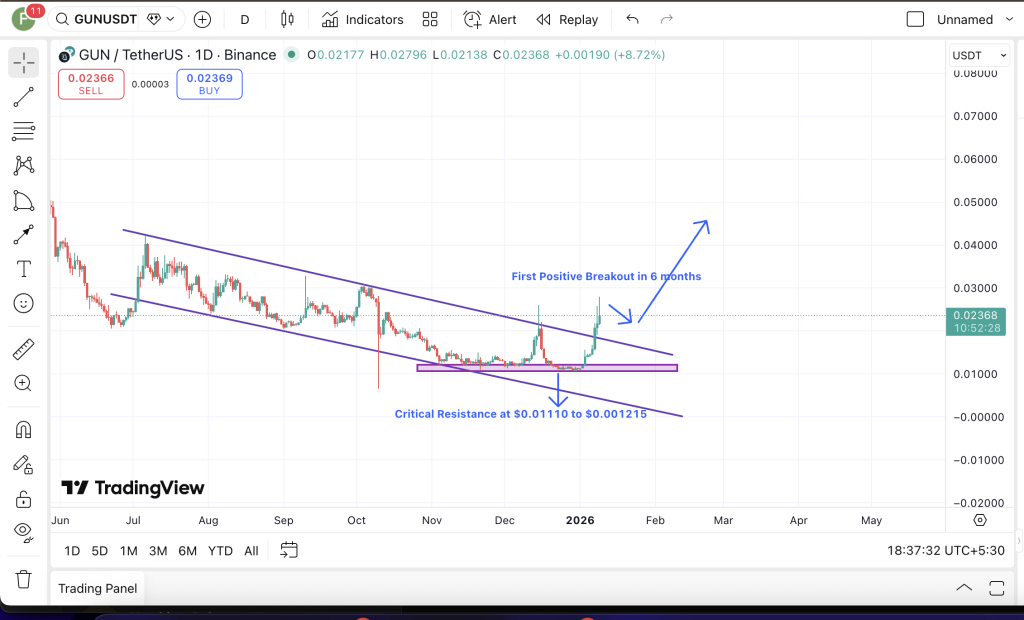
If the trend continues and fundamentals stay positive, GUN will be pushed into a higher highs and higher lows pattern.
The GUN/USDT Hourly Chart Is More Exciting
On the hourly chart, the price is moving above 100 day EMA and trading NEAR the upward resistance. The price may see a correction near the buying zone, but the support seems solid enough to hold the candles red for long.
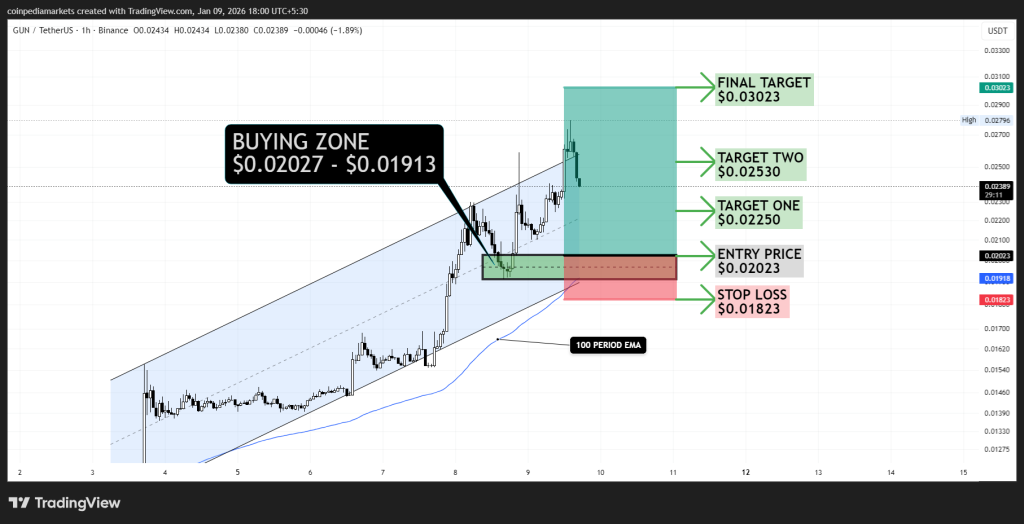
As seen, the RSI is now accelerating upward, and volume is facing volatility. The GUN/USDT pair could challenge the upper resistance soon. Traders must keep an eye on the marked entry zone of $0.02023/ GUN Coin.
