Ethereum Price Prediction: December 2025 Forecast Skyrockets to $4,500 as Bullish Signals Intensify

Ethereum's trajectory points toward unprecedented heights as market indicators flash green across the board.
The Technical Breakdown
Multiple technical formations converge to support the $4,500 projection—breaking through resistance levels that have held for months. Trading volume surges while institutional accumulation patterns mirror early 2024 behavior that preceded major breakouts.
Market Momentum Builds
DeFi protocols report record TVL growth, NFT markets show renewed activity, and layer-2 solutions demonstrate explosive adoption. The ecosystem expansion creates fundamental strength beneath the price action.
The Regulatory Landscape
Clearer regulatory frameworks emerge globally, removing uncertainty that previously capped upside potential. Traditional finance institutions quietly increase ETH allocations despite publicly dismissing crypto volatility.
December's $4,500 target represents not just a price point but a psychological threshold—proving Ethereum's resilience amid economic uncertainty that continues to plague traditional markets. Because nothing says 'stable investment' like an asset that can swing 20% before your morning coffee finishes brewing.
Ethereum’s Price Consolidation Near $3,800
The ETH/USD pair has been consolidating inside a symmetrical triangle pattern, forming higher lows since October. This compression phase, marked by reduced volatility, typically signals an approaching breakout. Key support sits at $3,680, while resistance NEAR $4,030 defines the short-term range.
The RSI near 46 remains neutral, hinting at equilibrium between buyers and sellers. Meanwhile, the 50-period EMA has flattened, reflecting short-term indecision. Yet, the pattern’s geometry and Ethereum’s structural strength, particularly its consistent higher lows, suggest a bullish bias once momentum picks up.
If ETH closes decisively above $4,030, it could trigger a MOVE toward $4,250 and $4,485, both previous reaction highs and critical resistance levels.
Bullish Continuation Pattern on Weekly Chart
On the weekly timeframe, Ethereum maintains a bullish flag pattern, a continuation signal often preceding upward extensions in an existing uptrend. This flag structure is supported by strong fundamentals, rising on-chain activity, scaling upgrades, and sustained institutional inflows into Ethereum-based ETFs and staking products.
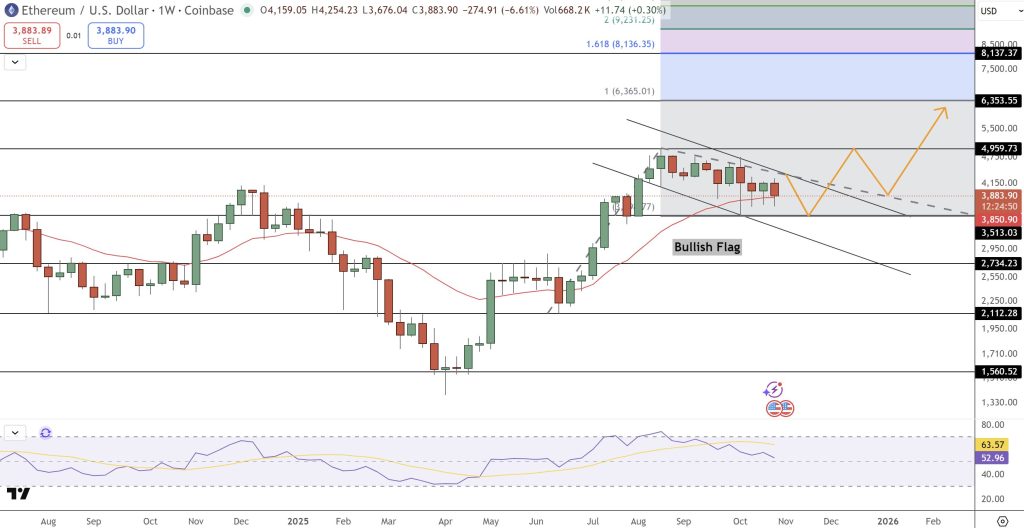
Key technical markers include:
- Support: $3,513 and $2,734
- Resistance: $4,960 and $6,353
- RSI: Hovering around 63, showing steady bullish momentum
If ETH breaks the $4,960 resistance, it could accelerate toward the Fibonacci 1.0 level at $6,353, with potential long-term extensions to $8,136 under favorable market conditions.
December 2025 Outlook and Trade Setup
Ethereum price prediction remains bullish as ETH’s tightening structure suggests that traders may soon face a pivotal moment. A breakout above $4,000–$4,100 WOULD validate bullish continuation, opening long setups toward $4,500 by December 2025. Conversely, a failure to hold above $3,680 may invite short-term weakness, but major supports remain intact above $3,500.
For long-term investors, Ethereum’s combination of robust network demand, consistent upgrades, and historical trend behavior supports a constructive outlook. A breakout from the flag could mark the beginning of Ethereum’s next major cycle, one that might redefine its valuation heading into 2026.
Ethereum Price Forecast: ETH Eyes $4,250 Breakout as Triangle Pattern Tightens
Ethereum (ETH/USD) is trading near $3,866, consolidating within a symmetrical triangle pattern as traders anticipate a decisive move. The chart reveals converging trendlines between support at $3,680 and resistance at $4,030, suggesting that volatility is tightening before a potential breakout.
Despite a slight dip of 0.29% in the past 24 hours, Ethereum’s market cap remains above $466 billion, maintaining its dominance as the second-largest cryptocurrency. The 4-hour EMA structure indicates indecision, with price action hovering around the 50-period EMA, while the RSI at 46 signals neutrality.
This positioning often precedes sharp directional moves as buyers and sellers compete for control near the pattern’s apex.

From a technical perspective, Ethereum is forming a series of higher lows, reflecting cautious accumulation despite macro uncertainty. If ETH successfully breaks above $4,030, traders could see a swift move toward the $4,250 and $4,485 resistance zones, both aligning with the upper boundary of the triangle and prior swing highs.
A close above these levels would likely confirm a bullish breakout, potentially extending the rally toward $4,750.
However, a breakdown below $3,680 could shift sentiment, exposing $3,500 and $3,350 as key downside targets. Watch for confirmation through candlestick behavior such as a bullish engulfing for upside validation or a bearish breakout candle for downside continuation.
Bitcoin Hyper: The Next Evolution of BTC on Solana?
Bitcoin Hyper ($HYPER) is bringing a new phase to the Bitcoin ecosystem. While BTC remains the gold standard for security, Bitcoin Hyper adds what it always lacked: Solana-level speed.
Built as the first Bitcoin-native Layer 2 powered by the Solana VIRTUAL Machine (SVM), it merges Bitcoin’s stability with Solana’s high-performance framework. The result: lightning-fast, low-cost smart contracts, decentralized apps, and even meme coin creation, all secured by Bitcoin.
Audited by Consult, the project emphasizes trust and scalability as adoption builds. And momentum is already strong. The presale has surpassed $25.5 million, with tokens priced at just $0.013205 before the next increase.
As bitcoin activity climbs and demand for efficient BTC-based apps rises, Bitcoin Hyper stands out as the bridge uniting two of crypto’s biggest ecosystems. If Bitcoin built the foundation, Bitcoin Hyper could make it fast, flexible, and fun again.
Click Here to Participate in the Presale
