Bitcoin Price Prediction: Why a $92,500 Breakout Is Back on Traders’ Radar

Bitcoin's next big move is brewing—and traders are eyeing a target that's making Wall Street's traditional metrics look quaint.
The Setup for a Surge
Forget sideways action. Momentum is building behind a key technical level, with market structure hinting at a potential explosive move. The chatter isn't about if, but when the dam breaks.
Why $92,500 Matters Now
That specific number isn't random. It represents a critical resistance zone—a ceiling that, once shattered, historically opens the floodgates for a sustained rally. Breaking it signals more than a price jump; it's a psychological victory that resets the market's ambition.
The Fuel in the Tank
On-chain data shows accumulation, not distribution. Large holders are steady, while liquidity patterns suggest a squeeze is forming. The macro backdrop, with its endless money-printing debates, provides the perfect kindling—proving once again that central banks are Bitcoin's best marketing department.
The Trader's Calculus
It's a simple equation: break and hold above the line, and the path clears toward six figures. Fail, and we're in for another consolidation chapter. The smart money is positioning for the former, treating any dip as a gift—a stark contrast to the quarterly panic seen in traditional equities.
One thing's clear: the market's patience is wearing thin, and the fuse on this breakout is getting shorter. The only question left is who's ready when it lights.
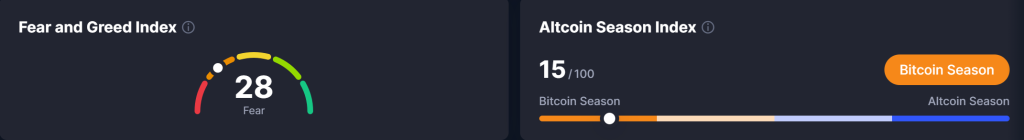
The market is on edge. The crypto fear & greed index is stuck in fear, and we’ve just seen a $99.9 million net outflow in recent ETF flow data, which only adds to short-term risk aversion.

Price Structure Signals Compression, Not Collapse
If we look at the 4-hour chart for Bitcoin, we see it’s been stuck in a descending channel for a while now, with higher and higher lows since the $94,600 peak and a steadily rising base at $82,500. This is a sign that the buyers and sellers are evenly matched at the moment.
Candlestick patterns add to that view. We’ve been seeing a lot of spinning tops and short-bodied candles recently, with mixed-up wicks, which is a classic sign of uncertainty and volatility.
Every time sellers have tried to push the price below $86,300, they’ve failed, while buyers have yet to reclaim $88,600 with any real conviction. The stalemate suggests that energy is building, with buyers and sellers waiting for the other to crack.
Key technical levels to watch are:
- Resistance levels are at $88,600, followed by $90,500 and $92,500
- Support levels are at $86,300, then $84,450
- 50- day EMA is near $87,800, and the 100- day EMA is near $88,400-$88,500
It’s worth noting that EMA compression in this area often leads to a big up or down move, rather than just a slow grind on.
Bitcoin Price Forecast: Momentum Stays Neutral as Breakout Risk Builds
Bitcoin price prediction seems slightly bullish Momentum indicators are confirming that this is a pause rather than a full-on crash. The RSI around 47-50 is neither overbought nor oversold, and more importantly, we’re not seeing any bearish divergences. The RSI has stabilised with price, suggesting this may be a period of consolidation rather than exhaustion.
If we look at the Fibonacci levels, bitcoin is still holding above 38.2% retracement, which keeps the overall structure neutral to constructive. Looking at this from a Fibonacci perspective, the setup looks like a contracting triangle within a descending channel – a pattern that historically resolves in a big up or down move.
If a bullish scenario were to unfold with a decisive break above $88,600, it could be followed by a run-up to $90,500, then a test of $92,500 NEAR the top of the channel. On the other hand, if support were to fail, then $86,300, then $83,800 are the levels to watch.
Bitcoin Price Outlook: Patience Before the Next Leg
Looking forward, the technical bias remains cautiously constructive as long as the price stays above $84,450. A confirmed break above $88,600 is a sign that the consolidation has done its job and could set the stage for a push back towards $92,500 and $94,600.
Maxi Doge: The Meme Coin Built for Maximum Hype
Maxi Doge is exploding in popularity as traders rush toward its high-energy meme identity and fast-growing presale. With over $4.36 million raised, it’s quickly becoming one of the standout meme tokens of the year.
The project mixes bold branding with real engagement features, from ROI contests to nonstop community events, giving it more personality and momentum than typical dog coins. Its shredded, leverage-obsessed mascot has already turned Maxi DOGE into a recognizable culture coin.
Holders can also stake $MAXI for daily smart-contract rewards and unlock access to exclusive competitions and partner events. The staking utility adds a passive-earning LAYER that keeps users active and invested in the ecosystem.
With $MAXI priced at $0.000275 and the next increase approaching, the presale continues to gain speed. If you’re looking for a meme coin built on hype, personality, and real community energy, Maxi Doge is shaping up to be one worth watching.
Click Here to Participate in the Presale