Dogecoin on-chain metrics signal a potential turning point once the crypto market stabilizes

- Dogecoin price hovers around $0.168 on Wednesday after bouncing off its 200-week EMA last week.
- Santiment’s data shows that DOGE utility and whale wallets are rising, hinting at a potential rally ahead.
- A weekly candlestick close below $0.136 would invalidate the bullish thesis.
Dogecoin (DOGE) price hovers around $0.168 on Wednesday after bouncing off its 200-week Exponential Moving Average (EMA) last week. Santiment’s data shows that DOGE’s utility and whale wallets are rising, hinting at a potential rally for the dog-themed memecoin.
On-chain data shows potential breakout ahead
Like most meme coins, Dogecoin has been hammered during the 2-month crypto-wide retracement phase. Despite this correction, Santiment data shows that wallets holding at least 1 million DOGE tokens have been rising since the start of February and have risen 1.24%. Moreover, active addresses are also at 4-month highs, reaching over 150,000 addresses. This rise in holders’ wallets and utility indicates a potential breakout on the horizon for the dog-themed memecoin.
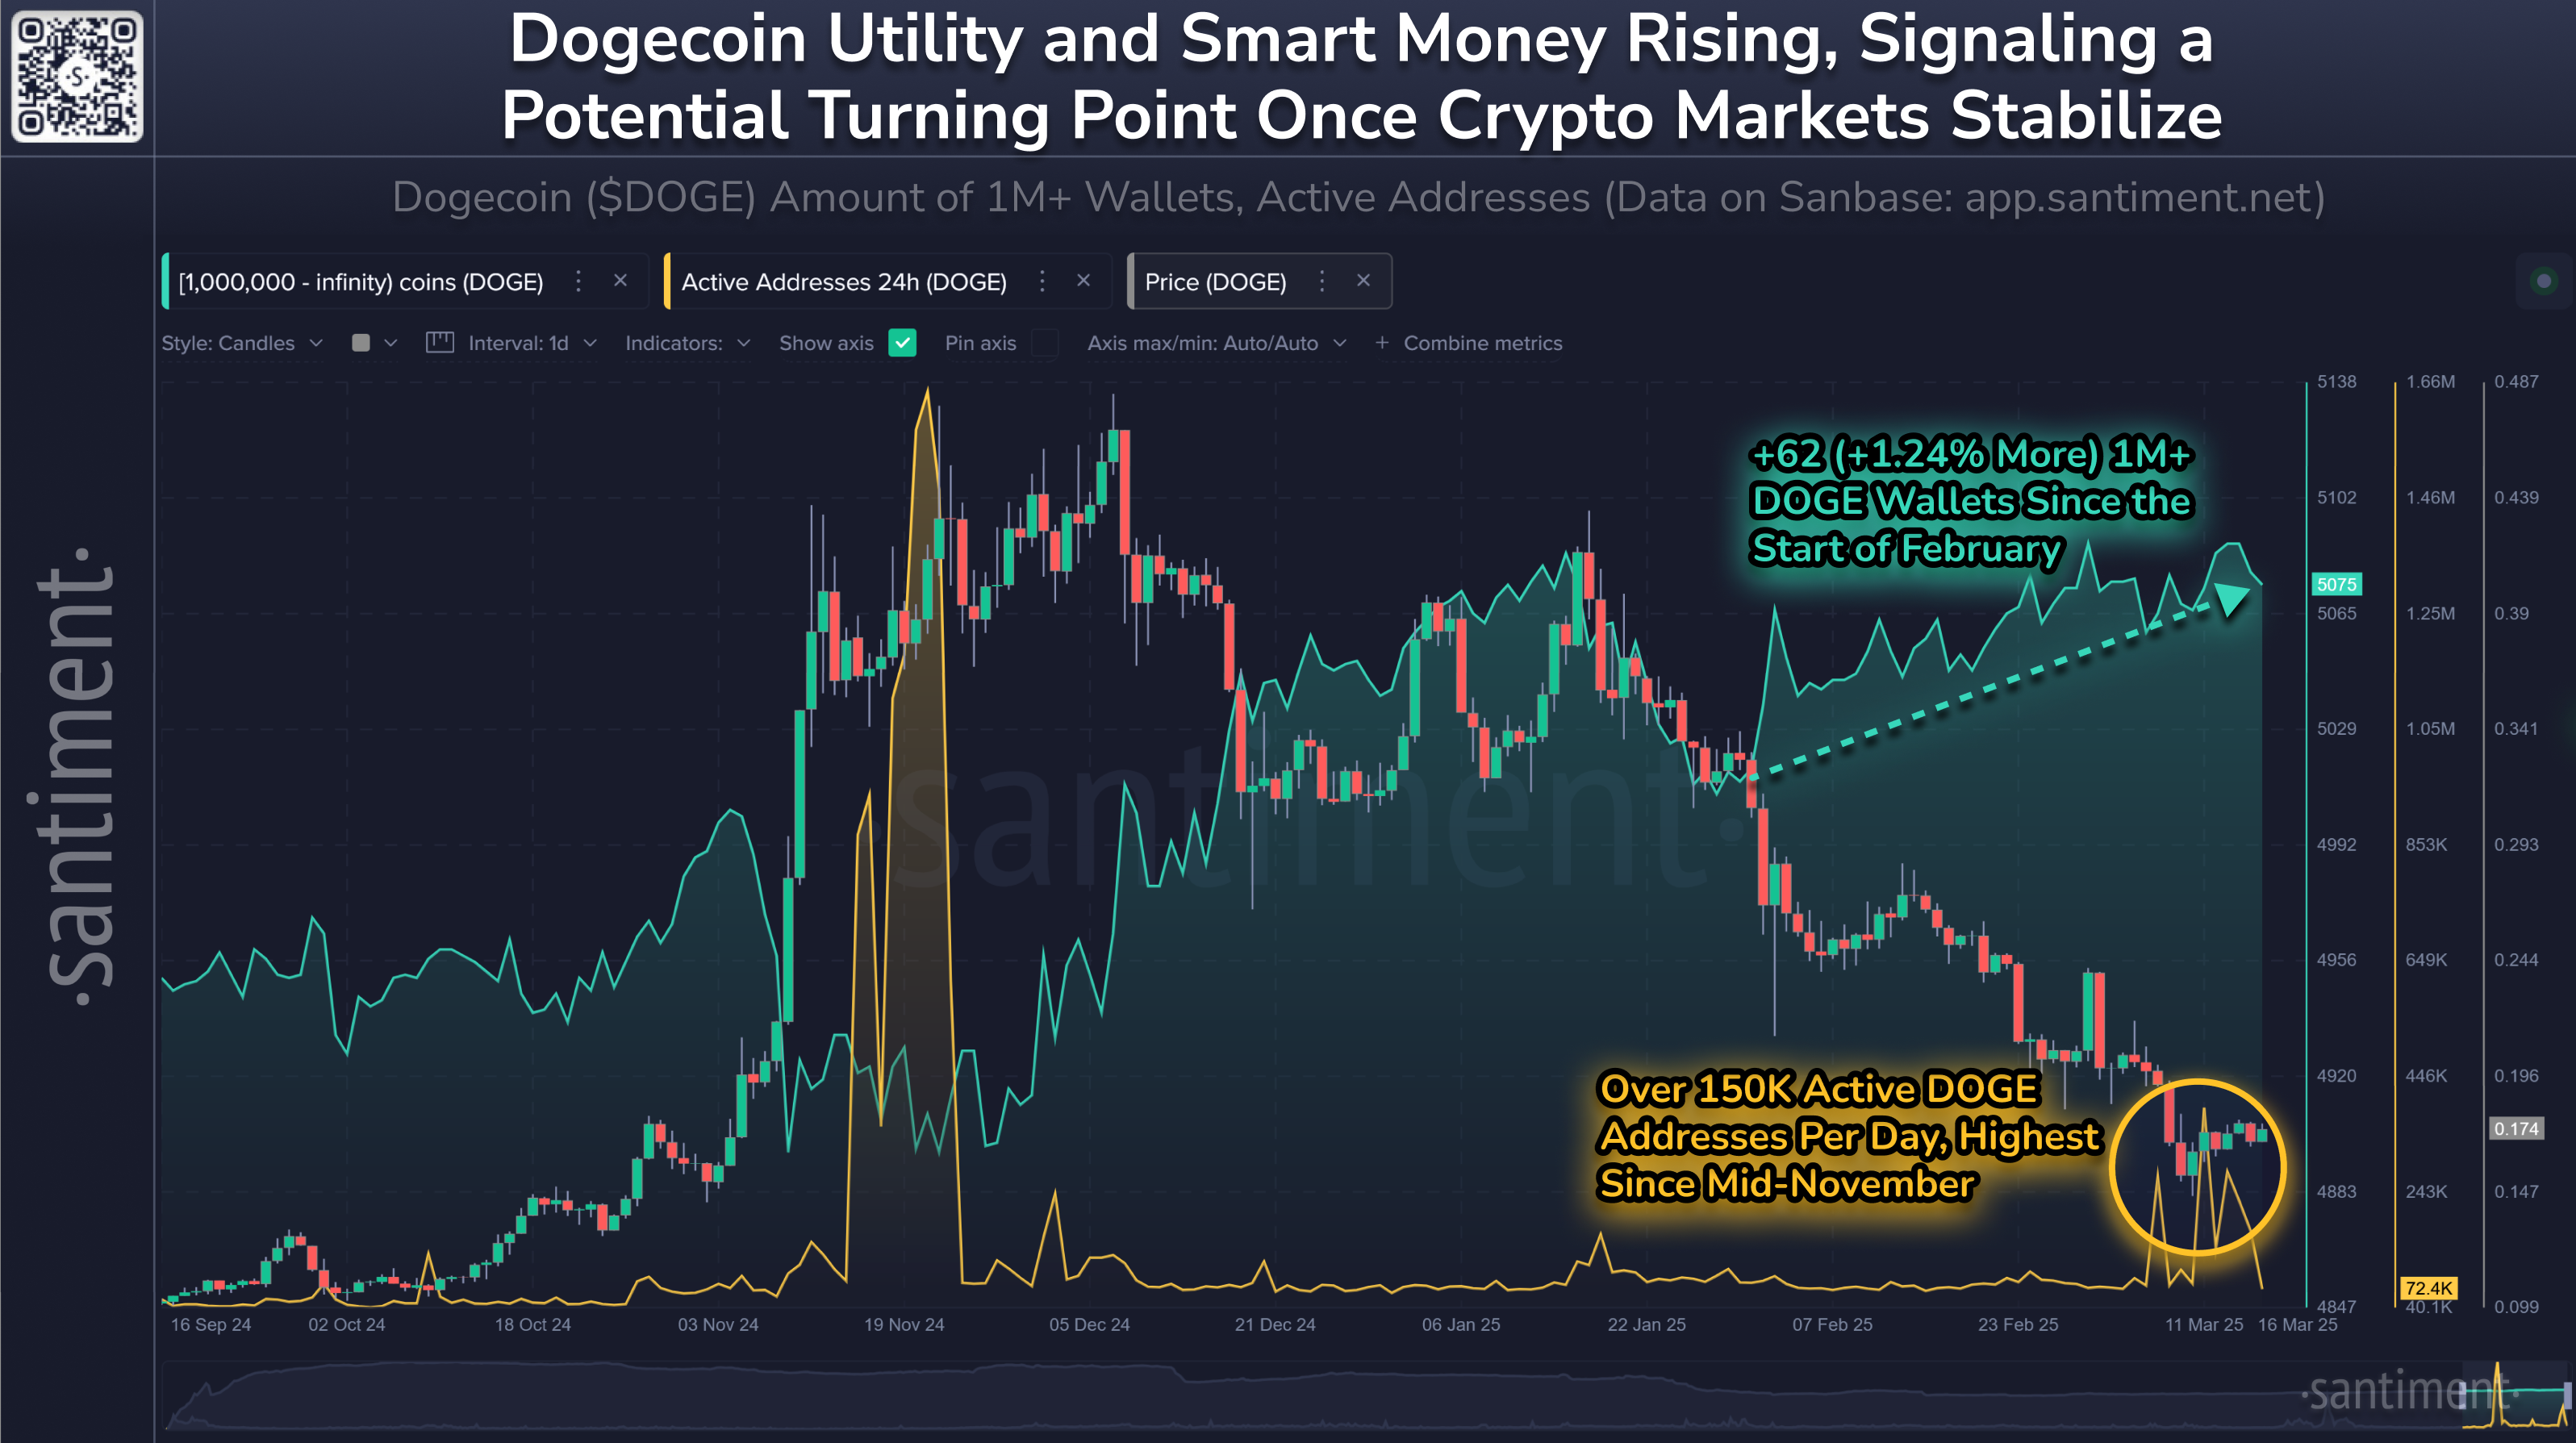
Dogecoin on-chain metric chart. Source: Santiment
Dogecoin technical outlook: Bulls aim for $0.22 mark if 200-week EMA support holds
Dogecoin price retested and found support around its 200-week EMA at $0.136 last week. As of Wednesday, Doge continues to trade above its 200-week EMA, hovering around $0.168.
If the 200-week EMA continues to hold and DOGE closes above the weekly resistance of $0.181, it could extend the rally to retest its next resistance level at $0.220.
The weekly chart’s Relative Strength Index (RSI) turns flat below its neutral level of 50, indicating an easing of bearish momentum and opening the door to a rebound.
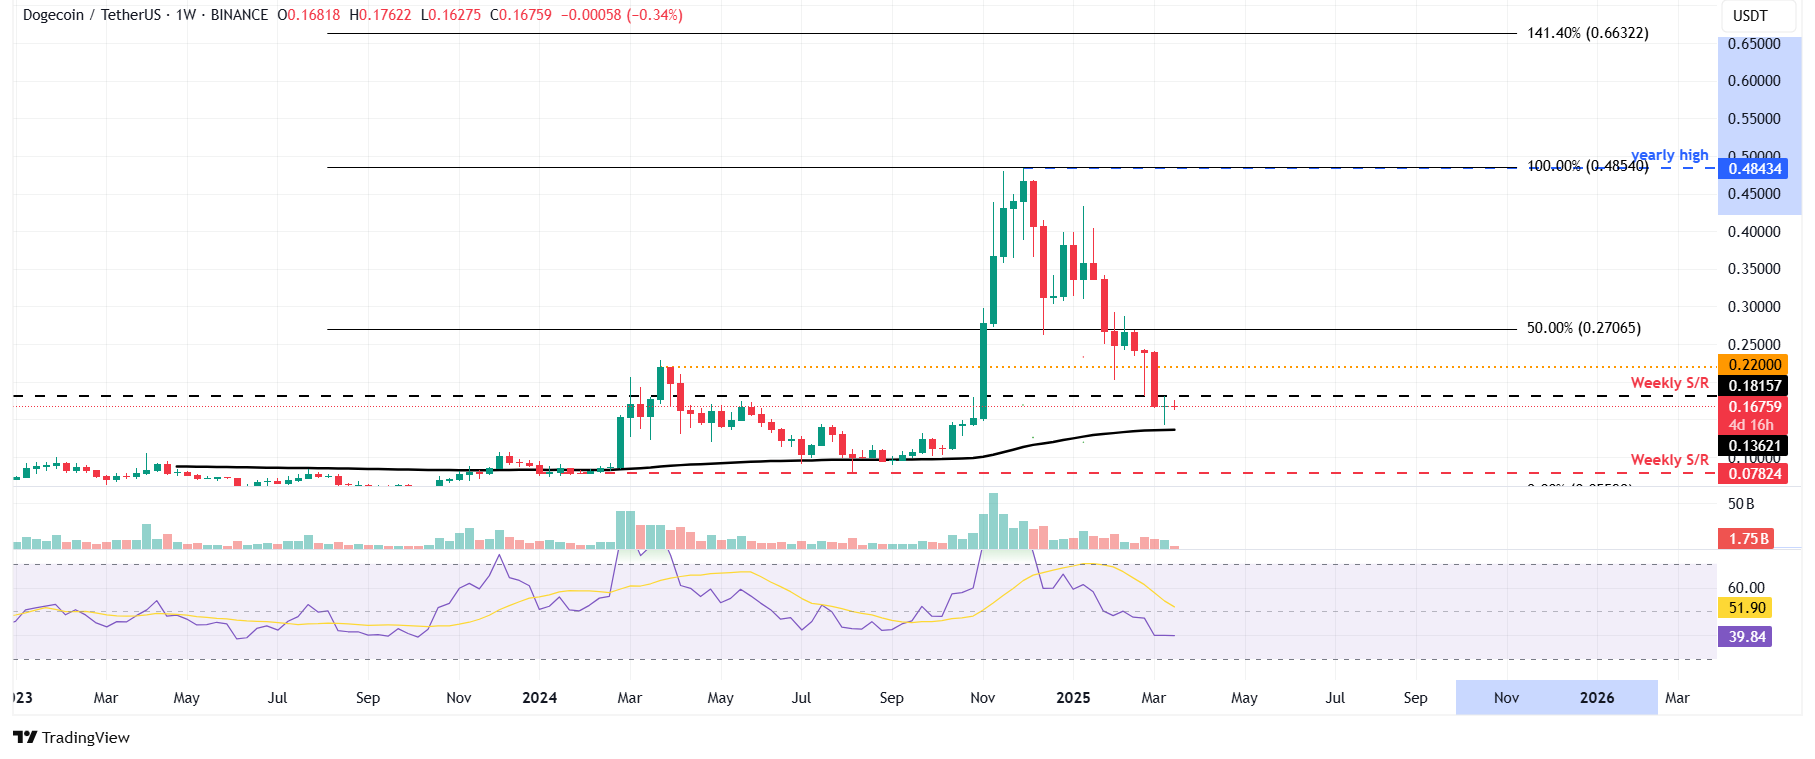
DOGE/USDT weekly chart
However, suppose DOGE fails to find support around the 200-week EMA and closes below it. In that case, the bullish thesis will be invalidated, leading to a decline to retest its next weekly support level at $0.078.

Log in to Reply
Log in to comment your thoughtsComments
Related Articles