Uniswap Whale Dumps 9M UNI on Coinbase Prime—Is a Price Plunge Coming?

A crypto whale just shifted $90M worth of UNI to Coinbase Prime—classic ’buy the rumor, sell the news’ or a bearish omen? Meanwhile, retail traders cling to hopium while the smart money cashes out. Just another day in decentralized finance’s casino economy.
Uniswap whale wallet moves nearly $54 million
Wu Blockchain’s X post on Thursday indicates that an address potentially associated with the Uniswap team, investor, or advisor transferred 9 million UNI worth $53.91 million to the Coinbase Prime Deposit on the same day.
The address of the suspected Uniswap team/investor/advisor: 0x69…E38B transferred 9 million UNI to Coinbase Prime Deposit at 9:17 UTC+8 today, worth about 53.91 million US dollars. https://t.co/BlqeAwensd
— Wu Blockchain (@WuBlockchain) April 24, 2025According to CoinGecko data, this token transfer represents approximately 1.5% of the current circulating supply of 600 million.
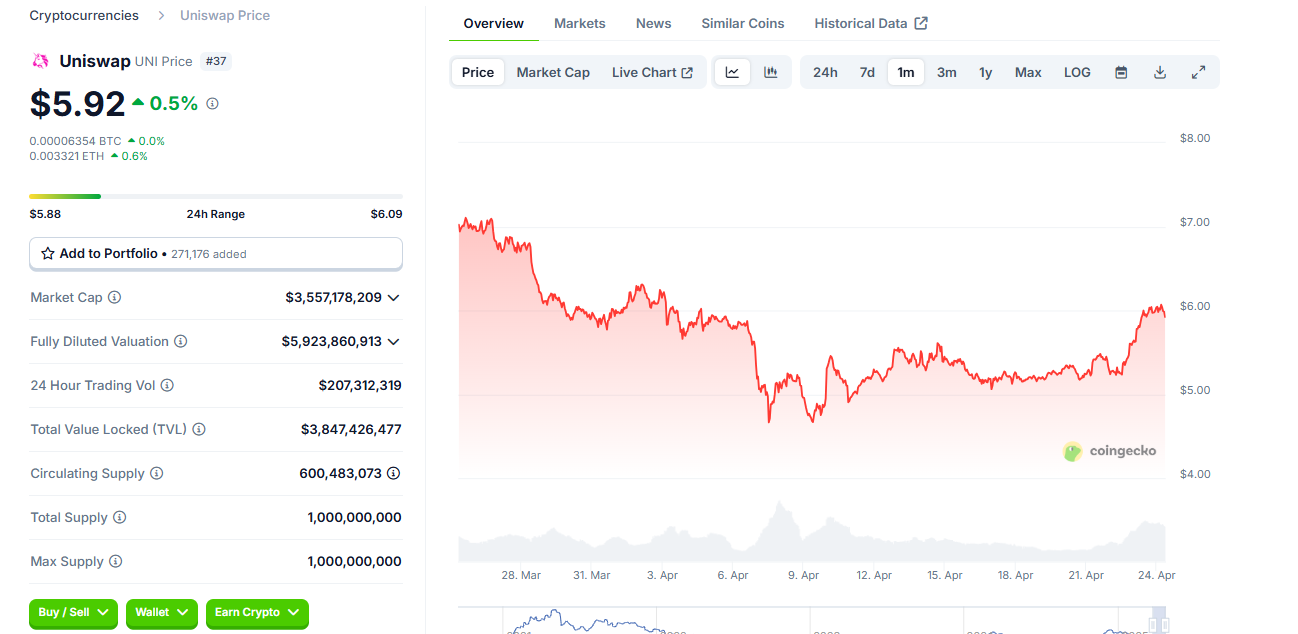
Uniswap chart. Source: CoinGecko
If this move signals an intent to liquidate or stake UNI, as Coinbase Prime often facilitates large-scale trading or custody for institutions, it could trigger volatility in UNI and generally lead to a short-term correction in the Uniswap price. Therefore, traders should exercise caution regarding this move.
Uniswap’s technical outlook shows resistance around its 50-day EMA
Uniswap price retested and found support around its August 5 low of $4.70 on April 9, and it has recovered nearly 27% in the last two weeks. However, at the time of writing on Tuesday, it faces resistance around its 50-day Exponential Moving Average at around $6.28 and is declining slightly.
If the 50-day EMA continues to hold as resistance, UNI could extend the decline to retest its next support level at $5.52. A successful close below this could extend an additional decline to test its August 5 low of $4.70.
The Relative Strength Index (RSI) on the daily chart reads 53, just above its neutral level of 50, and points downwards, indicating a fading of bullish momentum. However, if the RSI slips below its neutral level, it suggests a rise in bearish momentum and a sharp decline in Uniswap price.
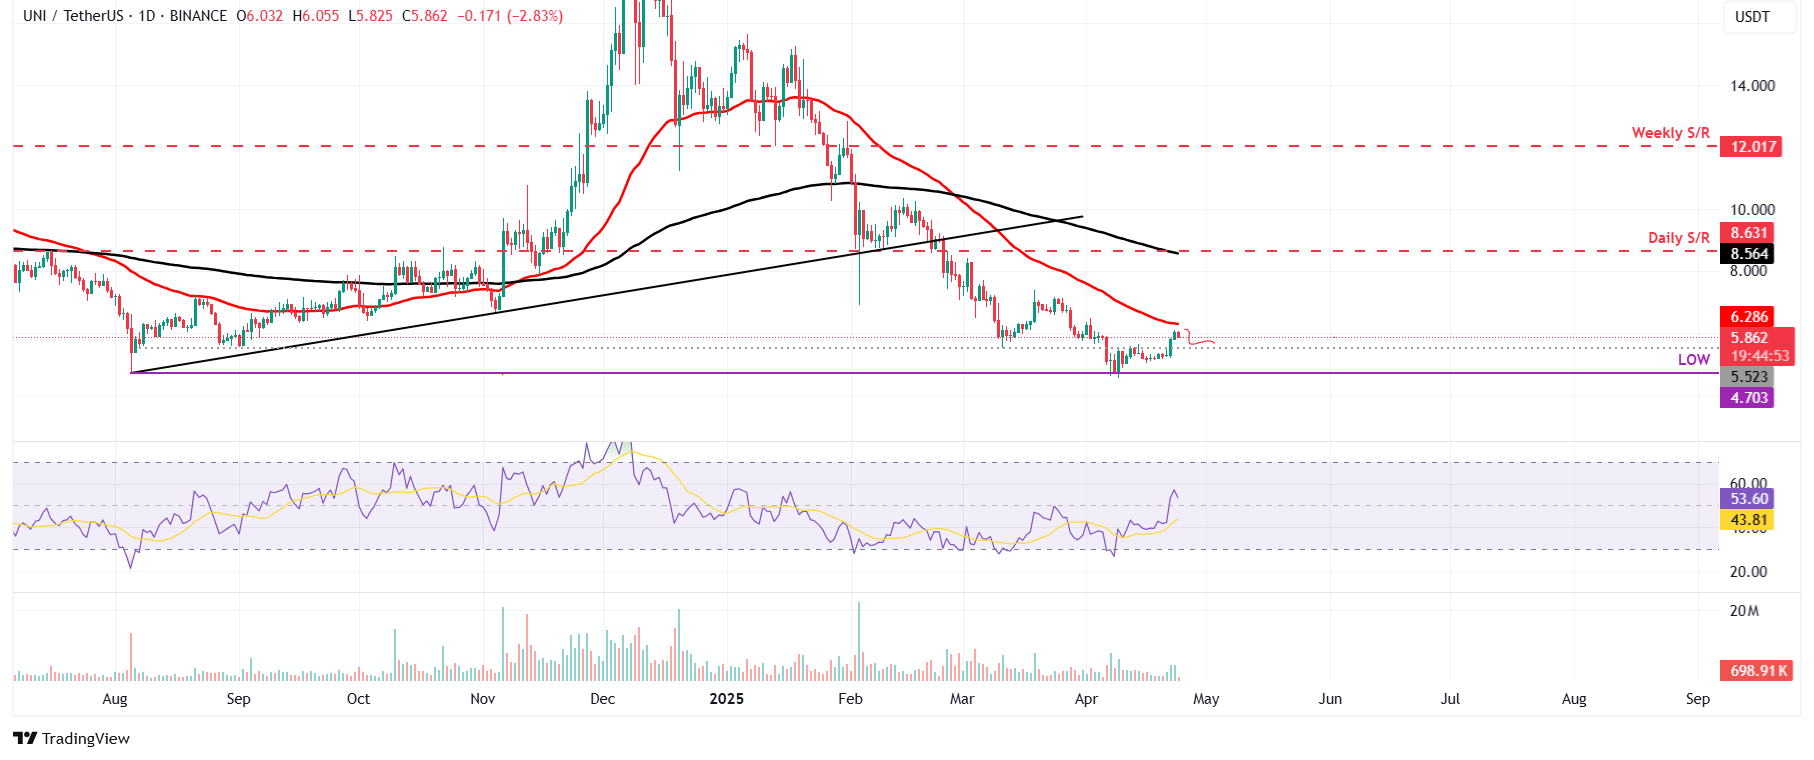
UNI/USDT daily chart
Conversely, if UNI breaks and closes above its 50-day EMA at $6.28, it could extend the rally to retest its psychologically important level of $7.

Log in to Reply
Log in to comment your thoughtsComments
Related Articles
|Square
Get the BTCC app to start your crypto journey
Get started today Scan to join our 100M+ users