Cardano (ADA) at a Crossroads: Temporary Dip or Bear Trap? Key Levels to Watch Before the Next Rally

Cardano's ADA takes a hit—but savvy traders see blood in the water, not a sinking ship. Here's where the smart money's betting on a turnaround.
Short-term pain, long-term gain?
ADA's price action looks ugly today, slicing through support like a hot knife through butter. But crypto isn't for the faint-hearted—this is where fortunes get made. The charts whisper 'oversold' while the herd screams 'panic.' Classic setup.
Watch these key levels
All eyes on the $0.45 zone—historically ADA's bounce playground. Break that, and we're in 'buy the rumor, sell the news' territory. Hold it? Cue the relief rally. Meanwhile, traditional finance bros are still trying to short Bitcoin with their spreadsheets.
The bottom line
This isn't ADA's first rodeo. Network upgrades keep coming, staking yields stay juicy, and the developers haven't stopped building. Either you believe in the tech or you're just here for the leverage—no judgment. Place your bets.
Cardano’s on-chain metric shows rising selling pressure
Santiment's Network Realized Profit/Loss (NPL) indicator computes a daily network-level Return On Investment (ROI) based on the coin's on-chain transaction volume. Strong spikes in a coin's NPL indicate that its holders are, on average, selling their bags at a significant profit. On the other hand, strong dips imply that the coin's holders are, on average, realizing losses, suggesting panic sell-offs and investor capitulation.
In the case of Cardano, the NPL indicator dipped from 23.13 million on Sunday to -26.56 million on Monday. This negative downtick indicates that the holders were, on average, realizing losses and suggests rising selling pressure. Historically, this development has triggered a capitulation event in ADA when a short price dip is followed by a surge in prices.
%20%5B07-1755574005901-1755574005914.43.34,%2019%20Aug,%202025%5D.png)
Cardano’s NPL chart. Source: Santiment
However, the short-term bearish outlook is further supported by the CryptoQuant data, as shown in The Graph below. The Taker CVD (Cumulative Volume Delta) for ADA has been negative and increasing, indicating the Taker Sell Dominant Phase, highlighting selling pressure.
-1755574063447-1755574063449.png)
Cardano Spot Taker CVD chart. Source: CryptoQuant
Cardano Price Forecast: ADA could dip before a higher leg
Cardano price reached above its psychological level of $1 on August 14, rallying nearly 20% last week. At the start of this week, on Monday, it declined by 3.88%. At the time of writing on Tuesday, it continues to trade down at around $0.91.
If ADA continues to face a correction, it could extend the decline toward its key support at $0.84.
The Relative Strength Index (RSI) on the daily chart reads 61 after facing rejection from its overbought territory on Sunday, indicating fading bullish momentum. The Moving Average Convergence Divergence (MACD) also showed falling green histogram bars, further supporting the fading bullish momentum thesis.
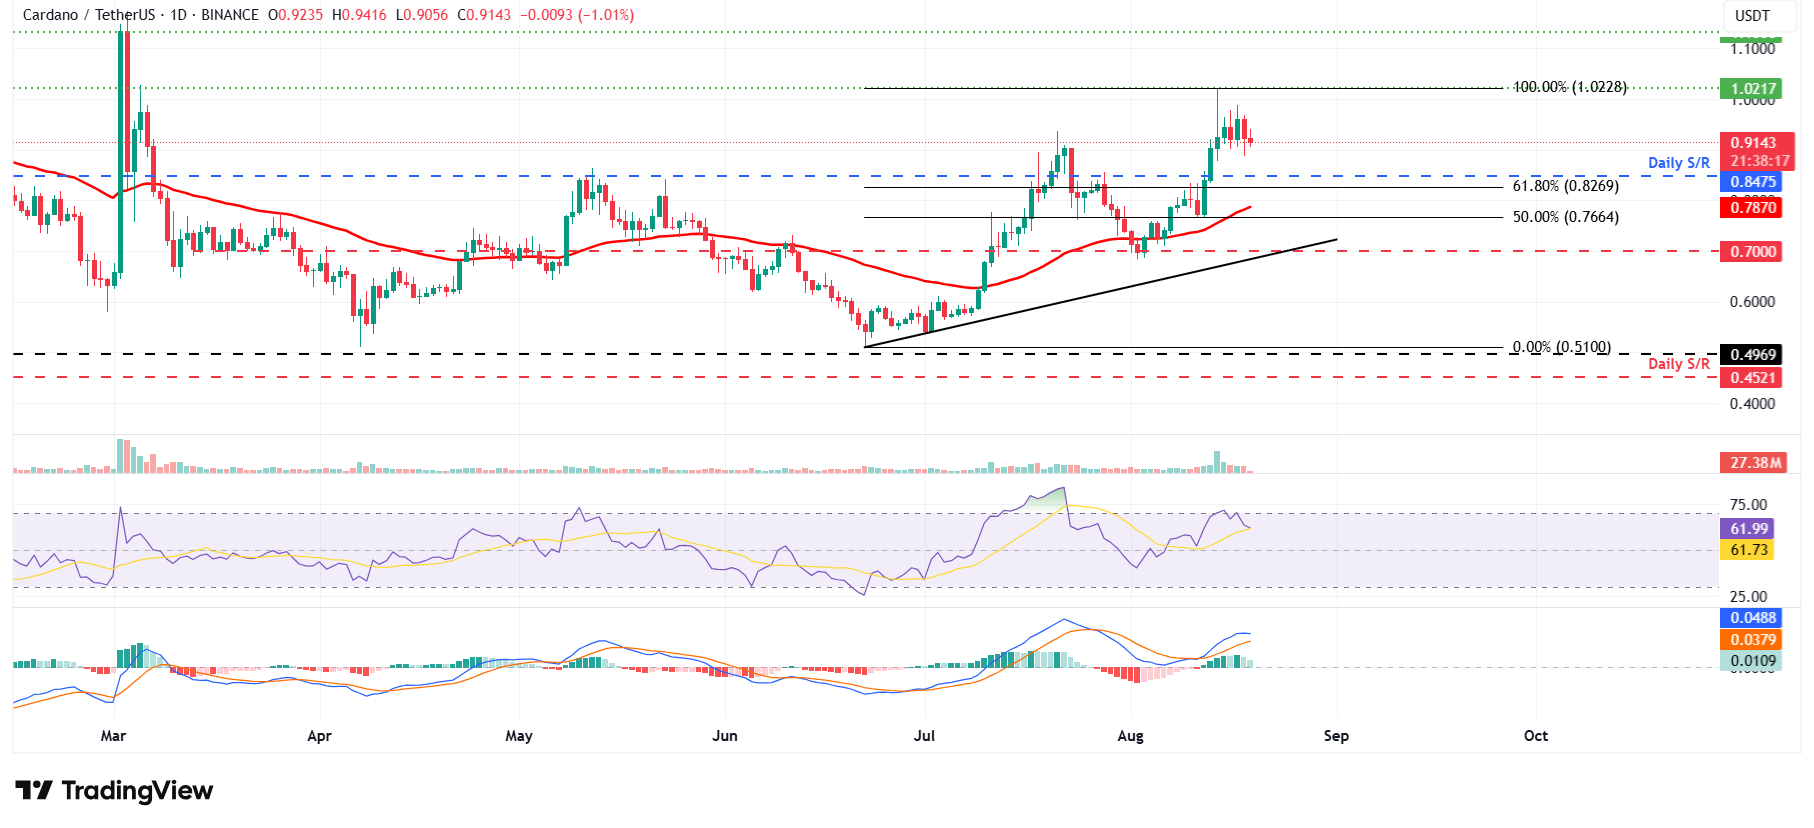
ADA/USDT daily chart
However, if ADA recovers, it could extend the rally toward its key psychological level of $1.
