Sui Price Forecast: SUI Plunges Below Critical Support—Momentum Indicator Signals Deeper Correction Ahead

SUI just sliced through its crucial support level like a hot knife through butter—and the momentum indicators aren't just flashing warning lights, they're screaming 'abandon ship.'
Technical Breakdown: What's Next?
The charts don't lie: Sui's price action looks uglier than a Monday morning portfolio statement. Key support? Shattered. Momentum? Bleeding out. This isn't a dip—it's a full-blown correction with legs.
Market Realities & Trader Sentiment
Traders are hitting sell buttons faster than a crypto influencer hyping a questionable token. The so-called 'support' level folded quicker than a regulated bank during a liquidity crisis—proving once again that in crypto, the only thing predictable is the unpredictability.
Bottom Line: Brace for Impact
Unless bulls stage a miracle rally, Sui's heading lower. Sometimes the market doesn't need a reason—it just needs an excuse to remind everyone who's really in charge.
Sui’s on-chain data leans bearish
CryptoQuant’s Taker CVD for sui is negative, and its value has been steadily decreasing since mid-July.
This metric measures the cumulative difference between market buy and sell volumes over three months. When the three-month CVD is positive and increasing, it suggests the Taker Buy Dominant Phase. A negative and decreasing value, as it is currently happening, indicates the Taker Sell Dominant Phase.
%20(2)-1755599840549-1755599840562.png)
SUI Spot Taker CVD chart. Source: CryptoQuant
Sui Price Forecast: Momentum indicators show weakness
Sui price closed below an ascending trendline (drawn by connecting multiple lows since mid-June) on Monday. It also closed below its daily support at $3.65 and its 61.8% Fibonacci retracement (drawn from the June low of $2.29 to the July high at $4.44) at $3.62, marking a shift in market structure from bullish to bearish. At the time of writing on Tuesday, it continues to trade down below $3.56.
If SUI continues its correction, it could extend the decline toward its daily support at $3.33. A successful close below this level could extend the losses toward its next daily support at $2.90.
The Relative Strength Index (RSI) edges lower and reads 45 on the daily chart, below its neutral level of 50, indicating bearish momentum. The Moving Average Convergence Divergence (MACD) also showed a bearish crossover on Friday, giving a sell signal and suggesting a downward trend ahead.
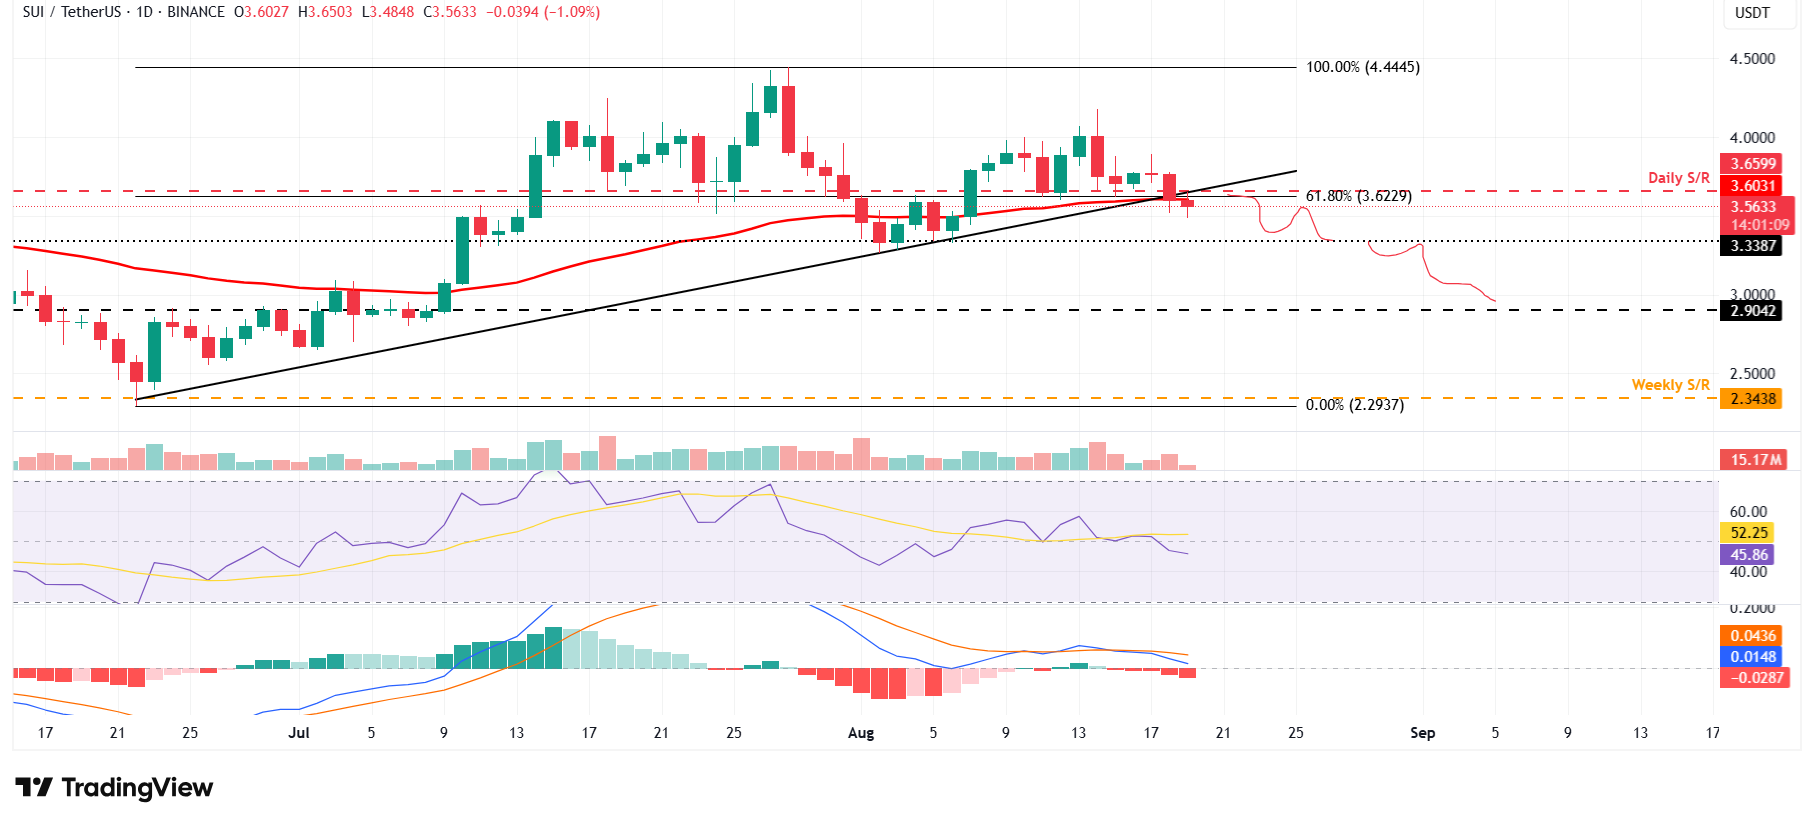
SUI/USDT daily chart
However, if SUI recovers and closes above the daily resistance at $3.65, it could extend the rally toward the August 14 high of $4.18.
