🚀 Crypto Gainers Today: OKB, Mantle, and MemeCore Soar as Markets Churn

Digital assets defy volatility with triple-digit breakouts—traders pile into narratives while traditional finance scrambles to keep up.
OKB leads the charge with institutional-grade momentum, Mantle rides layer-2 mania, and MemeCore proves degenerate gambling still prints. Each token’s surge highlights a different corner of crypto’s relentless innovation engine—no bankers required.
Forget waiting on your financial advisor’s permission slip; these moves happened while Wall Street was still debating whether Bitcoin is a ‘real asset.’
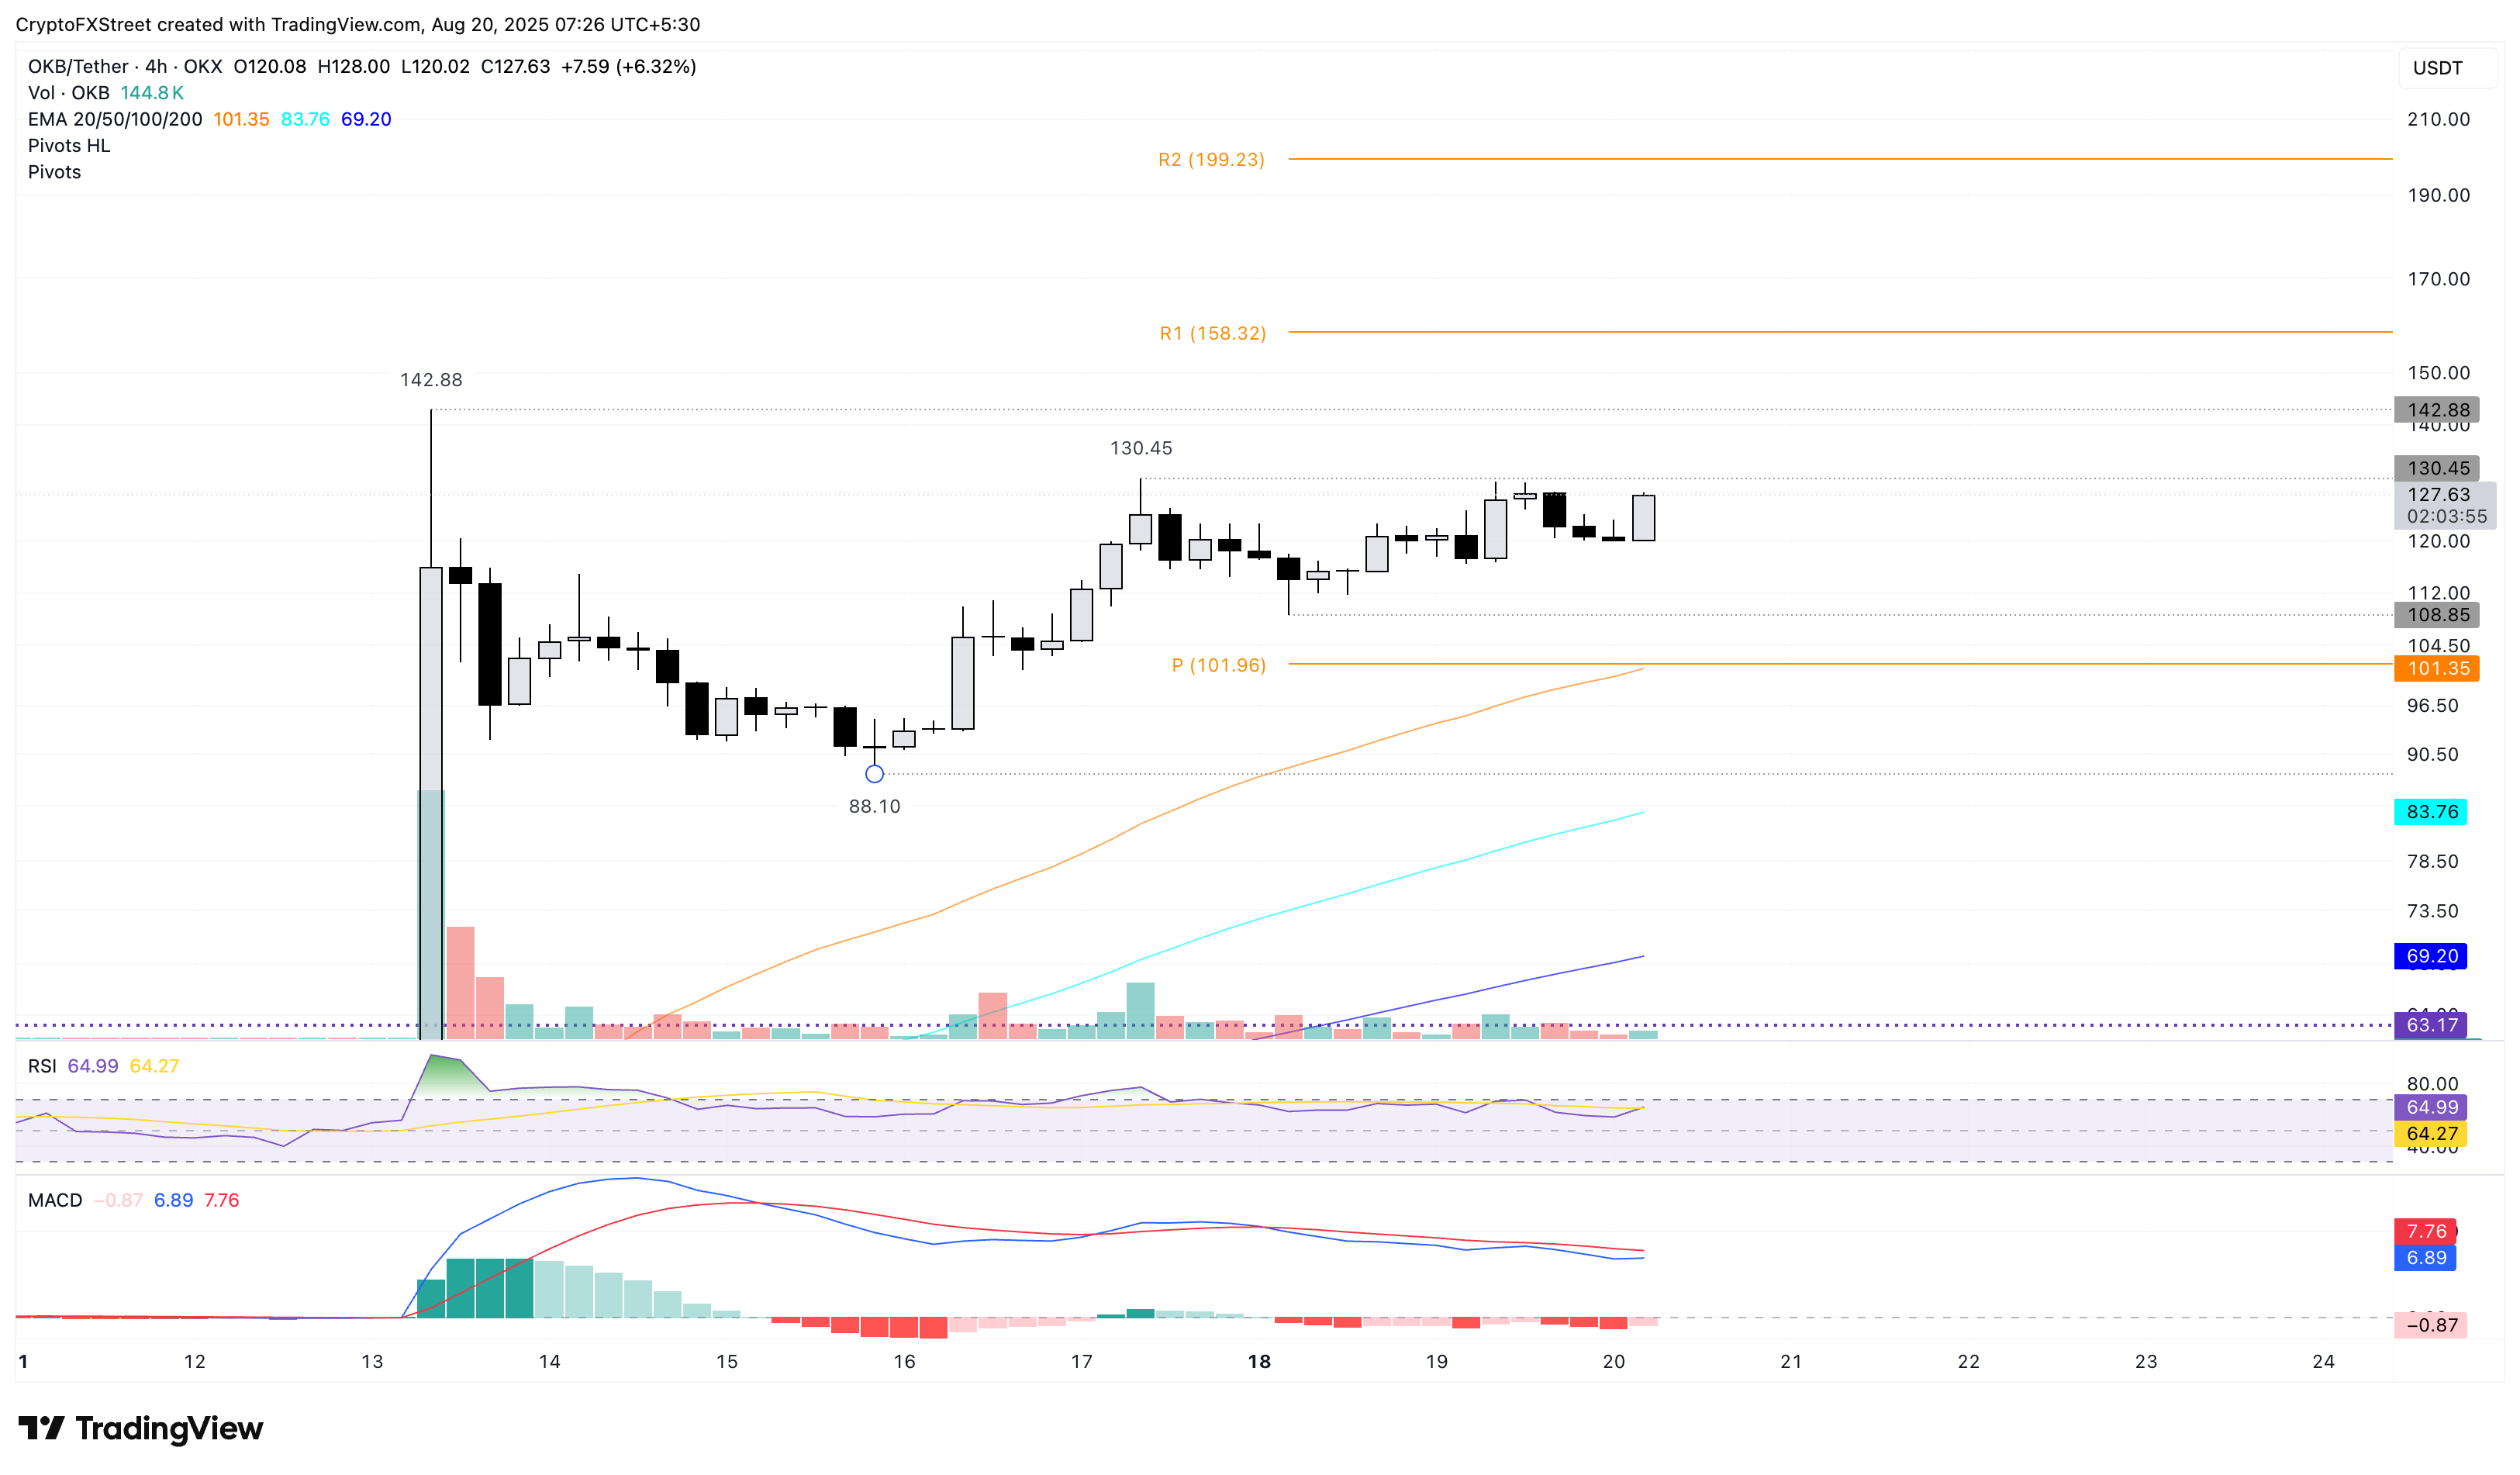
OKB inches closer to untested levels
OKB edges higher by nearly 5% at press time on Wednesday, maintaining an uptrend in the 4-hour chart (shared below). The recovery run targets the $130 pivot point from Sunday.
A decisive close above this level could extend the uptrend to the all-time high of $142, marked last week.
The momentum indicators on the 4-hour chart remain mixed. The Moving Average Convergence Divergence (MACD) and its signal line approach the zero line in a declining trend, indicating a gradual rise in bearish momentum.
Still, the Relative Strength Index (RSI) at 64 hovers NEAR the overbought boundary, indicating elevated buying pressure.
OKB/USDT daily price chart.
Looking down, a reversal from the $130 mark could test the centre pivot line at $101.
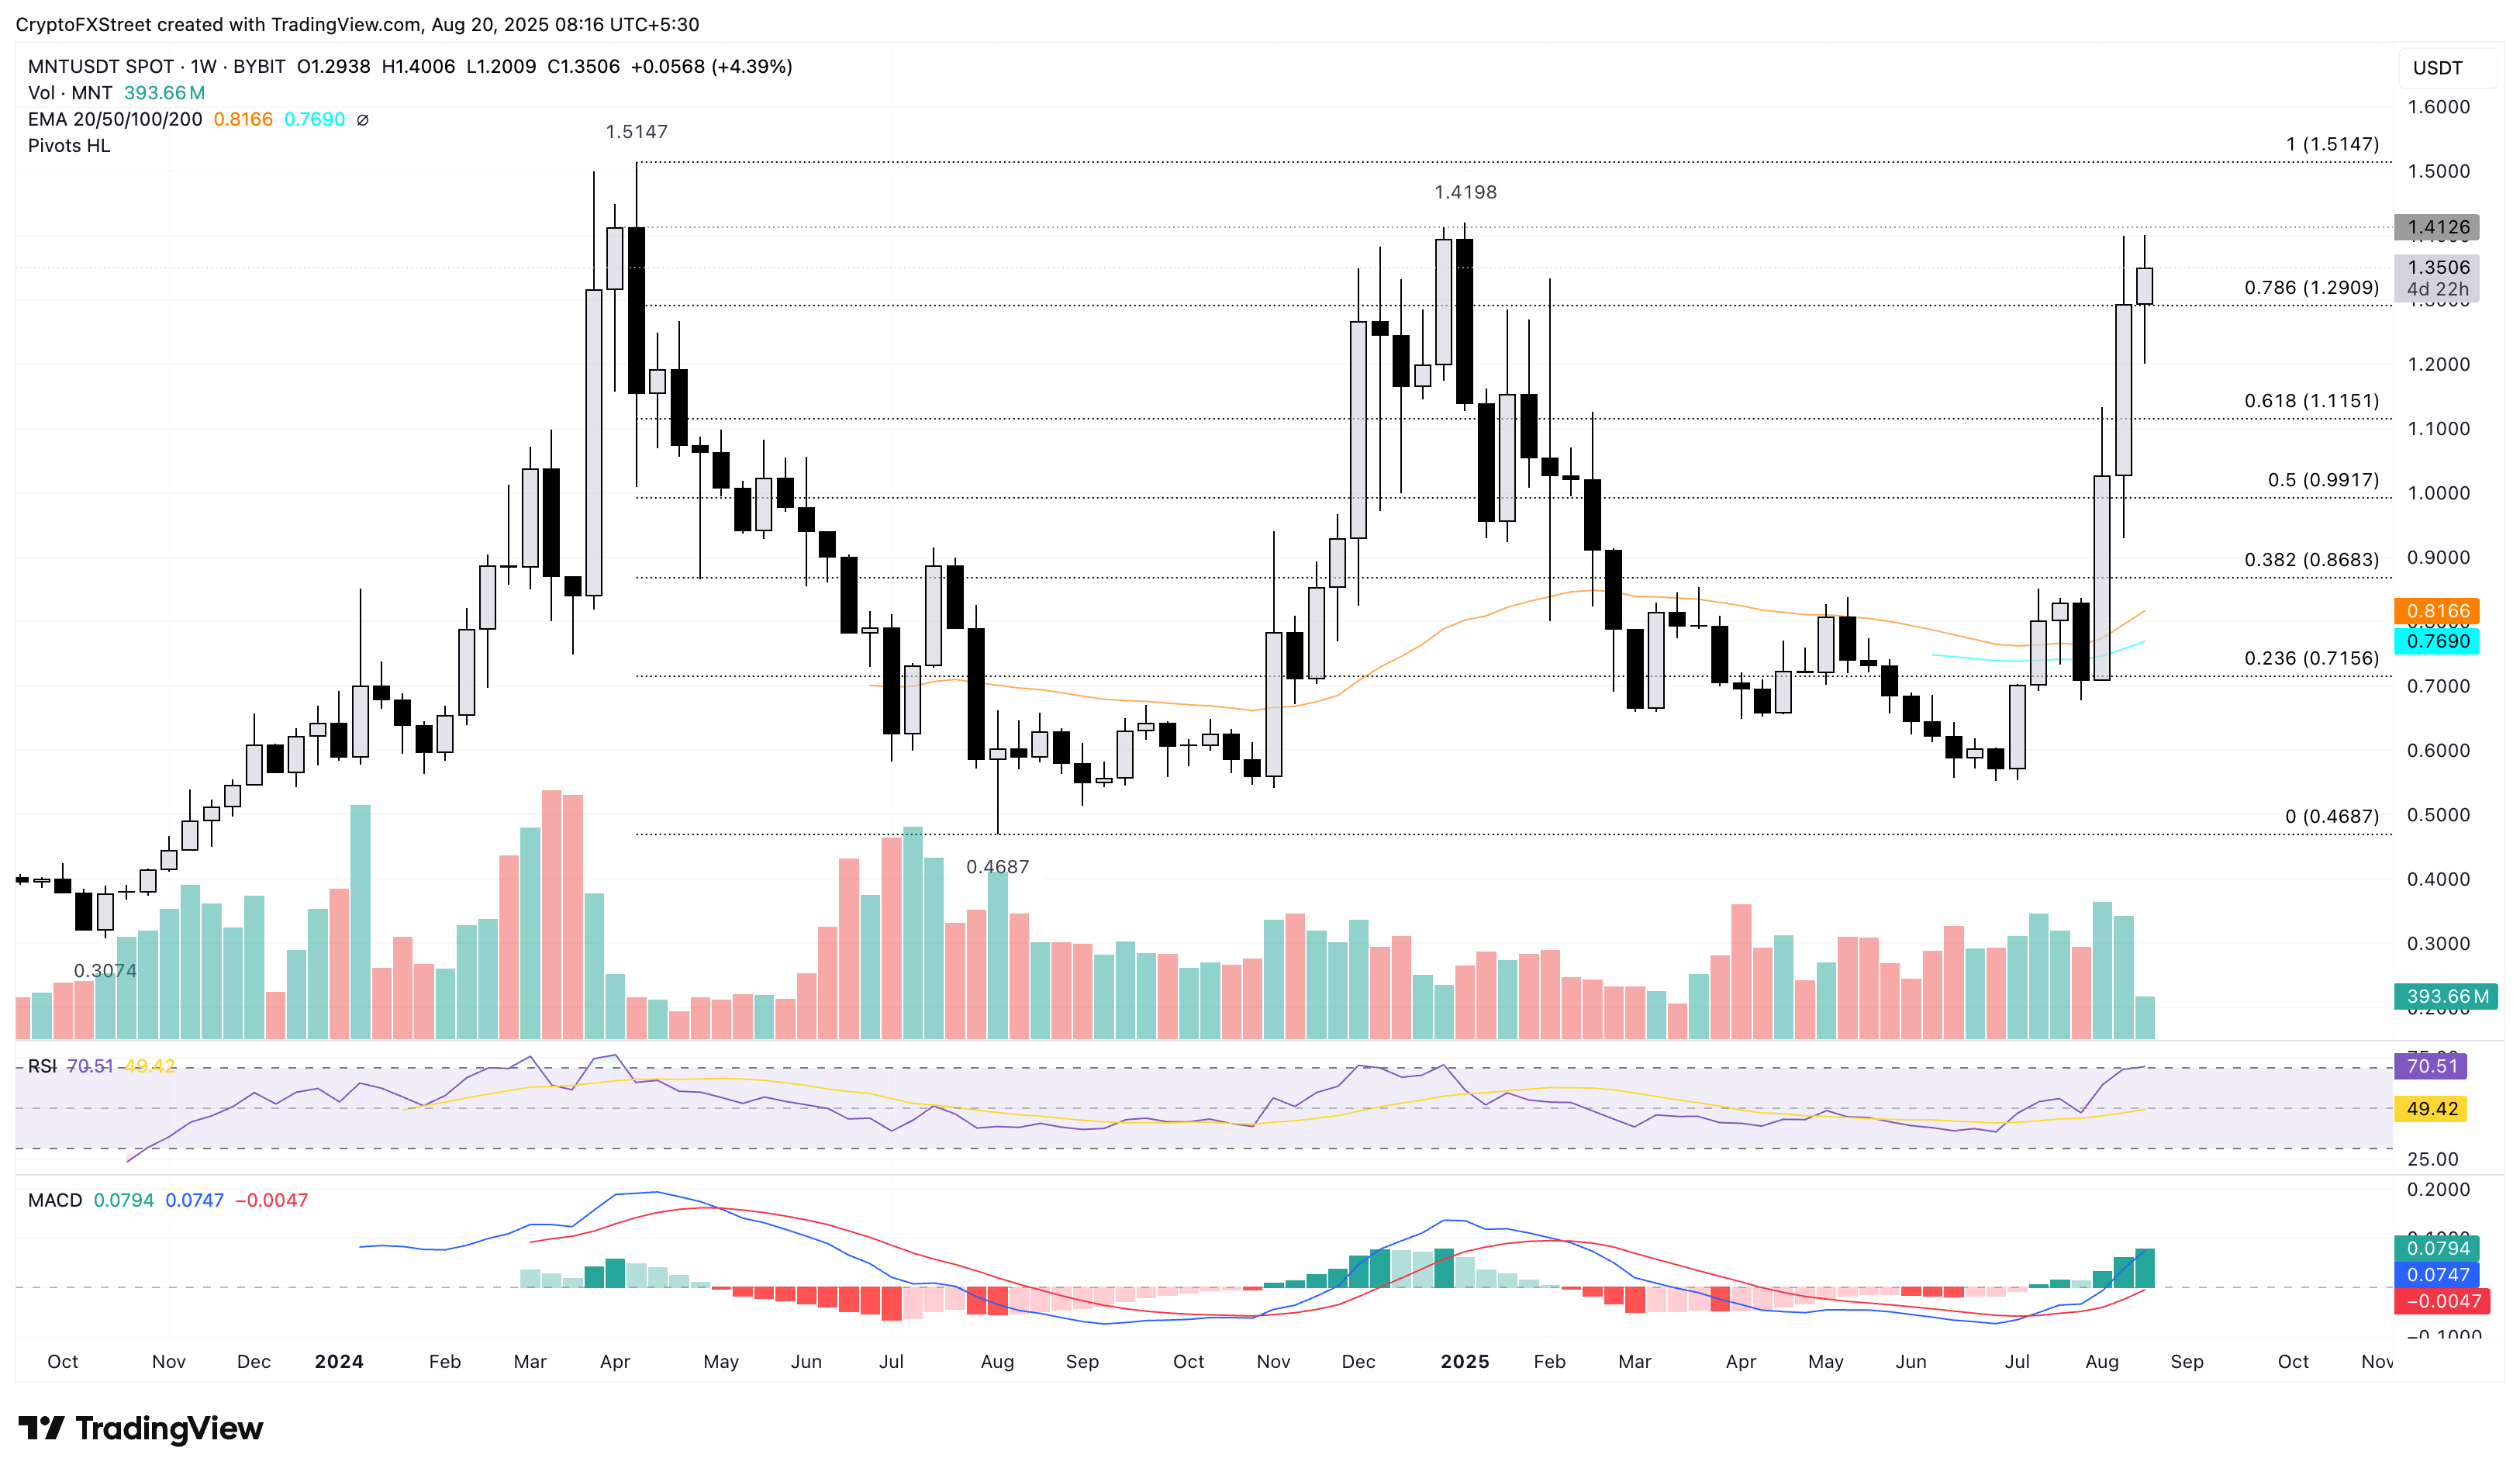
Mantle targets record high
Mantle trades at $1.35 at the time of writing on Wednesday, upholding the 4.30% gains from the previous day. MNT advances into its third consecutive bullish week, accounting for more than 80% gains so far in August.
The uptrend in Mantle targets the $1.41 pivot point, which is also the annual high, from early January. A clean weekly close above this level could drive the rally to its record high of $1.51.
The momentum indicators suggest a bullish bias on the weekly chart as the RSI at 70 hits the overbought boundary and the MACD and signal line rise into the positive territory, accompanied by a fresh wave of green histogram bars.
MNT/USDT weekly price chart.
On the flip side, a reversal could test the 78.6% Fibonacci level at $1.29, which is drawn from the $1.51 peak from April 8, 2024, to the $0.46 on August 5, 2024.
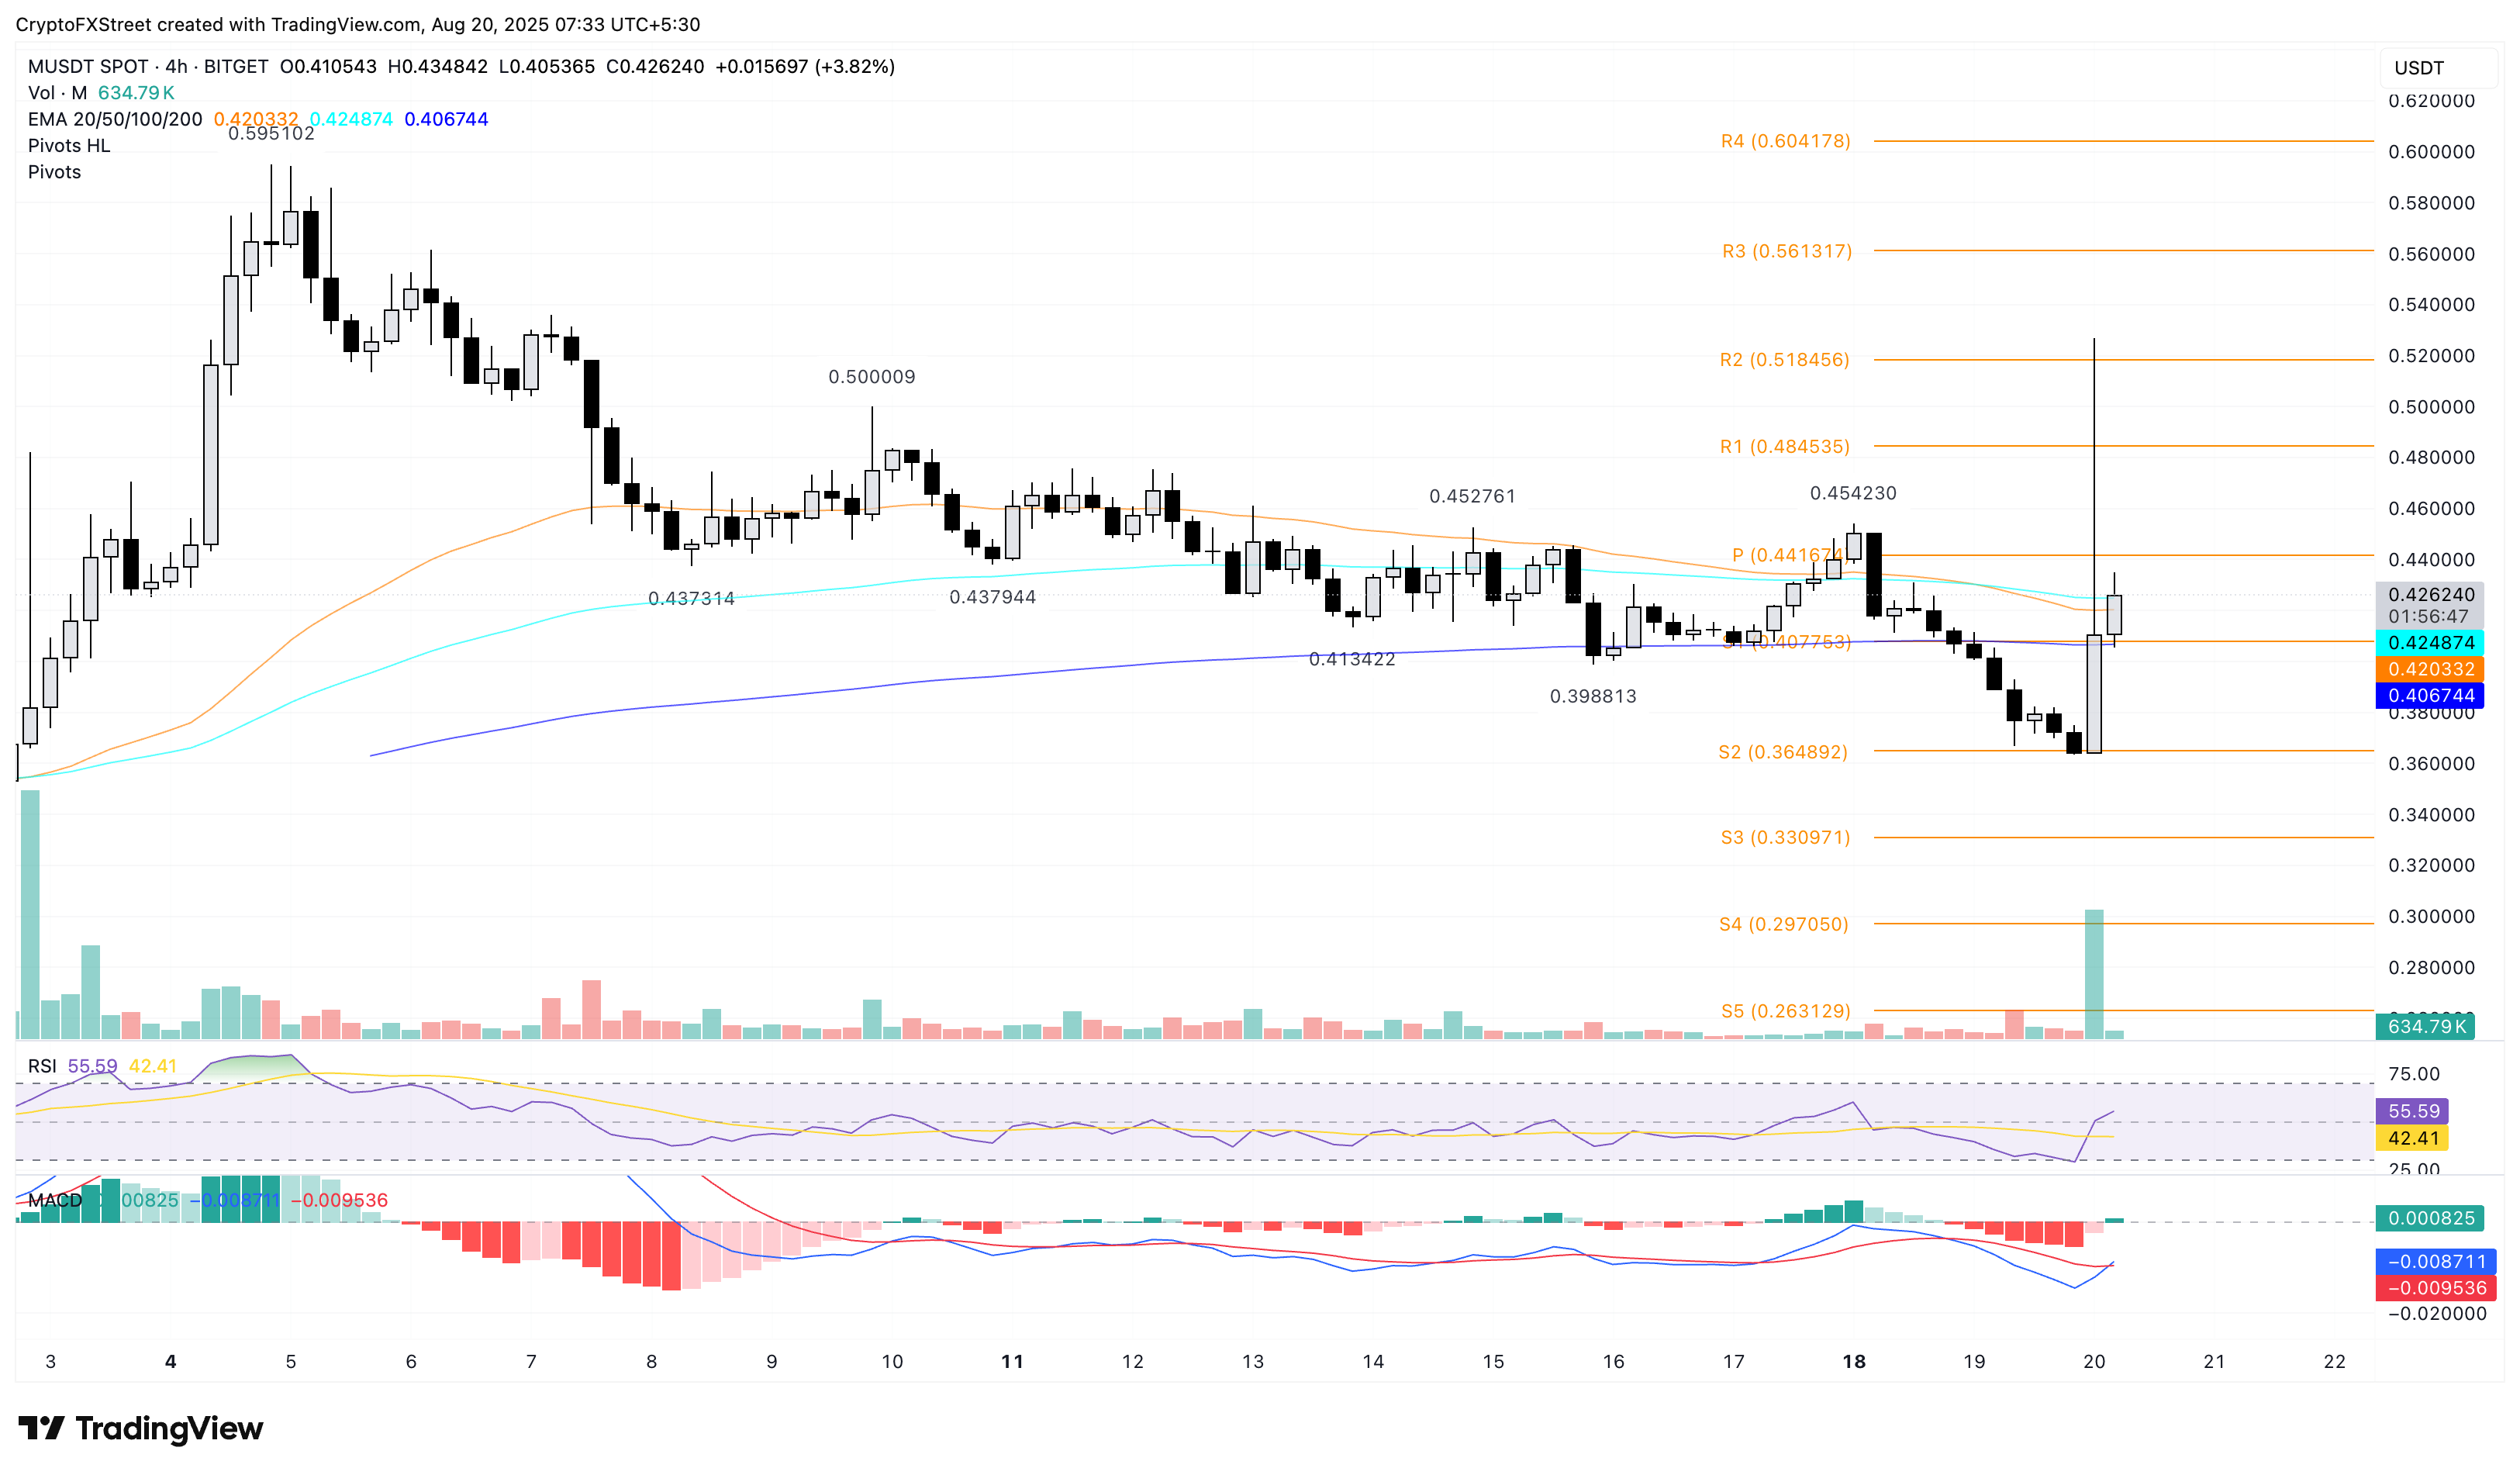
MemeCore’s reversal run eyes further gains
MemeCore bounces off the S2 pivot level at $0.3648 on the 4-hour chart after a sharp decline on Monday. At the time of writing, the meme coin trades at $0.4262, extending the reversal run, with the second consecutive bullish candle on the same chart.
The reversal rally should sustain above the 100-period Exponential Moving Average (EMA) at $0.4248 to extend the uptrend. If MemeCore marks a decisive 4-hour closing above this dynamic average line, it could extend the trend to the R1 pivot level at $0.4845.
The MACD crosses above its signal line while the RSI surpasses its halfway level, indicating a bullish shift in momentum.
M/USDT weekly price chart.
Looking downside, a pullback below the 200-period EMA at $0.4067 could retest the S2 pivot level at $0.3648.
