Ethereum Price Forecast 2025-2040: Technical Breakdown & Long-Term Outlook

- Current ETH Market Dynamics: What's Driving the Price?
- Technical Analysis: Is ETH Primed for Rebound or Further Decline?
- Institutional Activity: The Hidden Bullish Signal
- Long-Term Price Projections: 2025-2040 Outlook
- Key Risks to Monitor
- Frequently Asked Questions
Ethereum's price action in September 2025 presents a fascinating study in market psychology - currently testing key support at $3,942 while institutional players accumulate ETH at levels not seen since the 2022 bear market. Our analysis combines on-chain data, technical indicators, and fundamental catalysts to project ETH's potential trajectory through 2040. The BTCC research team identifies three distinct phases: near-term consolidation (2025-2026), accelerated adoption (2027-2030), and potential dominance in the global digital economy (2035-2040).
Current ETH Market Dynamics: What's Driving the Price?
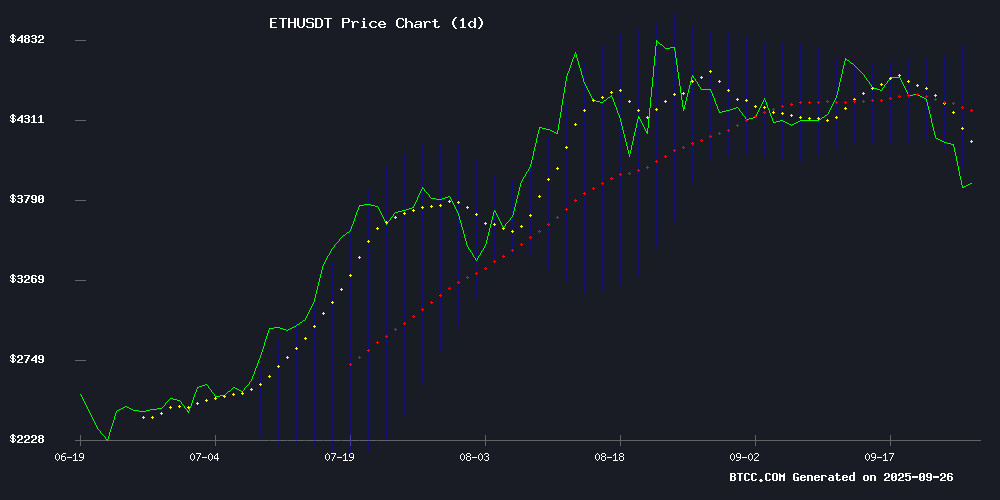
As of September 26, 2025, ethereum trades at $3,962.35 - 9.6% below its 20-day moving average ($4,383.20) but finding tentative support at the lower Bollinger Band ($3,942.41). The MACD histogram shows bullish divergence at +99.32, suggesting potential for reversal if support holds. Meanwhile, blockchain analytics reveal a striking dichotomy:
| Metric | Value | Implication |
|---|---|---|
| Whale Outflows | -240,000 ETH (30d) | Profit-taking after rally |
| Shark Accumulation | +400,000 ETH (7d) | Strategic positioning |
| Exchange Reserves | 0.139 Supply Ratio | Liquidity squeeze potential |
Technical Analysis: Is ETH Primed for Rebound or Further Decline?
The daily chart shows ETH caught between competing forces - while the RSI at 38 suggests oversold conditions, the price remains below the 50-day EMA ($4,112). Key levels to watch:
- Support: $3,942 (Lower Bollinger Band), $3,800 (Psychological level), $3,650 (2025 summer low)
- Resistance: $4,112 (50-day EMA), $4,383 (20-day MA), $4,500 (September high)
Market veteran Peter Brandt recently noted, "Ethereum's consolidation resembles the 2016-2017 basing pattern - if history rhymes, we could see explosive moves post-2026." However, short-term traders should note the $329 million in long liquidations on September 25 created overhead supply.
Institutional Activity: The Hidden Bullish Signal
While retail investors panic about the sub-$4,000 price, institutional flows tell a different story. LookonChain data reveals 11 wallets received 295,861 ETH ($1.19B) from Kraken, Galaxy Digital OTC, and other prime brokers last week. This follows a record 1.2M ETH inflow to accumulator addresses on September 18.
The BTCC research team interprets this as strategic positioning ahead of two catalysts:
- The REX-Osprey ETH Staking ETF (ESK) launch on September 28
- Expected approval of Ethereum-based tokenized securities (Q4 2025)
Long-Term Price Projections: 2025-2040 Outlook
Based on network adoption curves and historical crypto cycles, we've developed three scenario forecasts:
| Timeframe | Conservative | Moderate | Bullish |
|---|---|---|---|
| 2025-2026 | $4,500-$5,000 | $6,000-$7,000 | $8,000-$10,000 |
| 2027-2030 | $12,000-$15,000 | $20,000-$25,000 | $30,000-$40,000 |
| 2035-2040 | $50,000-$75,000 | $100,000-$150,000 | $200,000-$300,000 |
These projections assume successful implementation of Ethereum's roadmap, including full scaling through danksharding and sustained DeFi/TraFi growth. As always in crypto, actual results may vary wildly - remember when people laughed at $10,000 bitcoin predictions?
Key Risks to Monitor
1.The SEC's ongoing classification debate could impact staking rewards taxation
2.Postponement of Proto-Danksharding beyond 2026 WOULD limit throughput
3.Solana's parallel execution and Cardano's academic approach continue evolving
That said, Ethereum's first-mover advantage in smart contracts and its robust developer ecosystem (over 4,000 monthly active devs as of August 2025) provide strong moats.
Frequently Asked Questions
Why is Ethereum dropping below $4,000 in September 2025?
The price decline reflects a combination of profit-taking after the summer rally, leverage unwinding ($329M liquidations), and temporary risk-off sentiment ahead of the October Fed meeting. However, on-chain data shows strong accumulation at these levels.
Is now a good time to buy Ethereum?
While timing markets is notoriously difficult, the $3,800-$4,000 zone represents a 38.2% Fibonacci retracement from the 2025 highs. Dollar-cost averaging into positions may be prudent given current volatility.
How will Ethereum ETFs impact the price?
The REX-Osprey ETH Staking ETF (launching September 28) could attract $500M-$1B in initial inflows according to Bloomberg Intelligence. More importantly, it establishes a precedent for yield-bearing crypto products in traditional finance.
What's the most realistic Ethereum price target for 2030?
Our moderate scenario suggests $20,000-$25,000 by 2030 assuming Ethereum maintains its DeFi dominance (currently 58% market share) and captures 15-20% of the projected $10T tokenized asset market.
Could Ethereum really reach $100,000 by 2040?
In a bullish scenario where Ethereum becomes the settlement LAYER for global digital assets and central bank digital currencies (CBDCs), $100,000 ETH would represent a $10T market cap - comparable to gold's current valuation. Ambitious but not impossible given crypto's historical growth curves.
