Dogecoin’s Parabolic Surge Inevitable - Historical Patterns Signal Imminent Breakout, Analysts Confirm

Dogecoin's rocket appears ready for launch again as technical analysts spot familiar patterns forming on the charts.
The Meme Coin's Mathematical Destiny
Historical data reveals Dogecoin's price movements follow distinct cyclical patterns that have preceded every major breakout in its history. The same technical formations that predicted its 2021 surge are now reappearing with uncanny precision.
Market indicators align perfectly with previous parabolic runs, suggesting the digital asset could be preparing for another exponential move upward. Trading volume patterns mirror those seen before previous all-time highs.
While traditional finance analysts scratch their heads at a meme-based cryptocurrency's persistent relevance, Dogecoin continues to defy conventional market logic—proving once again that in crypto, sometimes the joke's on the skeptics.
Dogecoin Hasn’t Pumped Yet This Cycle
One such example is a recent analysis that was posted on the social media platform X, where the analyst noted that Dogecoin hasn’t actually pumped up in the current cycle yet.
Related Reading: Dogecoin Is Sitting On A Powder Keg: Here’s The Explosion That Will Send Price To $1.3
The chart posted by the analyst draws attention to a series of descending trendlines that Dogecoin has historically broken through and gone on exponential rallies shortly after. These periods often lasted years, with prices moving sideways and testing investor patience before then going on a rapid pump.
Particularly, the analyst highlighted the 2017 breakout, where Dogecoin climbed out of a multi-year base, retested the moving average, and then rallied in the months after. As well as the 2021 rally, where the meme coin broke above the multi-year base and retested the moving average again before finally soaring to its current all-time high of $0.7316.
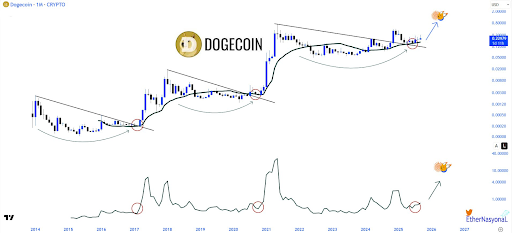
The current setup shows Dogecoin in a similar position. Having broken above the resistance trendline months back, the Dogecoin price went back to retest the monthly moving average again, as shown by the red circle in the chart below.
Now, it seems Dogecoin is trying to extend a rally, as evidenced by the price action in the past two months above $0.22. If history repeats, the present stage may be laying the groundwork for yet another multi-month price surge.
The Current Cycle Looks Different
Dogecoin’s current price cycle presents unique dynamics compared to past rallies. Unlike in 2017 or 2021, which were mostly based on meme coin hype, Dogecoin is now trading in a crypto market with higher liquidity and greater institutional investments. As such, the factors for any projected rally at this point will depend on the amount of institutional inflows that come into Dogecoin.
Discussions around Spot Dogecoin ETFs have added a new dimension to how capital could flow into the asset. If such products gain regulatory approval, they could open up Dogecoin to institutional inflows, much like what has already been seen with Bitcoin and ethereum ETFs.
Nonetheless, Dogecoin’s on-chain data and trading metrics have begun to reflect behavior consistent with accumulation phases seen ahead of past breakouts. September, in particular, has been highlighted by multiple whale purchases. For example, Doge whales added 2.08 billion DOGE to their holdings during the most recent price pullback below $0.23.
At the time of writing, Dogecoin is trading at $0.231.
