Bitcoin Bulls Battle Resistance—Will They Break Through or Get Trampled?

Bitcoin’s price action hits a critical inflection point as bulls charge against stubborn resistance levels. The crypto king needs a decisive surge to confirm upward momentum—or risk another rejection.
Key technical hurdles loom large. Traders watch for volume spikes that could signal a breakout, while skeptics eye overleveraged longs. Same old story—greed and fear dueling in the charts.
Meanwhile, Wall Street ’experts’ still can’t decide if BTC is digital gold or a speculative toy. Maybe it’s both—just like their beloved derivatives.
Bitcoin Price Consolidates Gains
Bitcoin price found support NEAR the $106,650 zone and recently started an upside correction. BTC traded above the $107,500 and $108,000 resistance levels.
There was a MOVE above the 50% Fib retracement level of the recent decline from the $111,982 swing high to the $106,672 low. The price even spiked above the $110,000 resistance zone. However, the bears were active near the $110,200 level.
The price failed to settle above the 61.8% Fib retracement level of the recent decline from the $111,982 swing high to the $106,672 low. Bitcoin is now trading above $108,500 and the 100 hourly Simple moving average. There is also a connecting bullish trend line forming with support at $109,200 on the hourly chart of the BTC/USD pair.
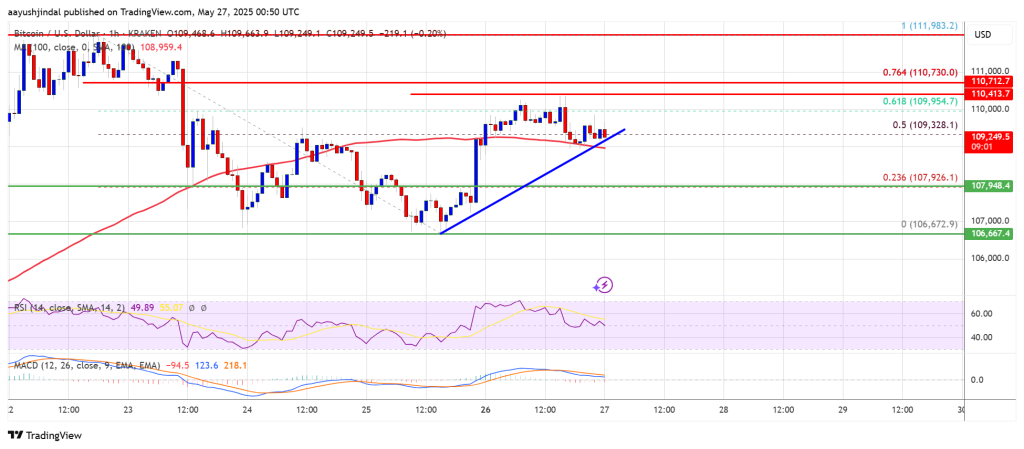
On the upside, immediate resistance is near the $110,000 level. The first key resistance is near the $110,750 level. The next key resistance could be $111,800. A close above the $111,800 resistance might send the price further higher. In the stated case, the price could rise and test the $113,000 resistance level. Any more gains might send the price toward the $115,000 level.
Another Decline In BTC?
If bitcoin fails to rise above the $110,000 resistance zone, it could start another correction. Immediate support on the downside is near the $109,200 level. The first major support is near the $108,500 level.
The next support is now near the $107,500 zone. Any more losses might send the price toward the $106,200 support in the near term. The main support sits at $105,000, below which BTC might gain bearish momentum.
Technical indicators:
Hourly MACD – The MACD is now losing pace in the bullish zone.
Hourly RSI (Relative Strength Index) – The RSI for BTC/USD is now above the 50 level.
Major Support Levels – $108,500, followed by $107,500.
Major Resistance Levels – $110,000 and $110,750.

Log in to Reply
Log in to comment your thoughtsComments
Related Articles
|Square
Get the BTCC app to start your crypto journey
Get started today Scan to join our 100M+ users