PENGU Plunges 11%—But These TA Signals Scream Buy Opportunity

Blood in the water for PENGU holders as the token tanks double-digits—but charts hint at a vicious comeback.
Technical analysis flashes bullish divergence as oversold RSI meets historic support. Whale accumulation spikes while retail panics. Classic.
Will this be another 'buy when there's fear' moment? Or just another shitcoin gravestone? Either way, the leverage traders are licking their chops.
Funny how these 'dips' always happen right before CEX listings. *adjusts tinfoil hat*
Pudgy Penguins May Be Gearing Up For A Rebound
In a new post on X, analyst Ali Martinez has talked about some signals forming in the hourly price of Pudgy Penguins. Below is the PENGU chart shared by Martinez, highlighting these bullish setups that have appeared recently.
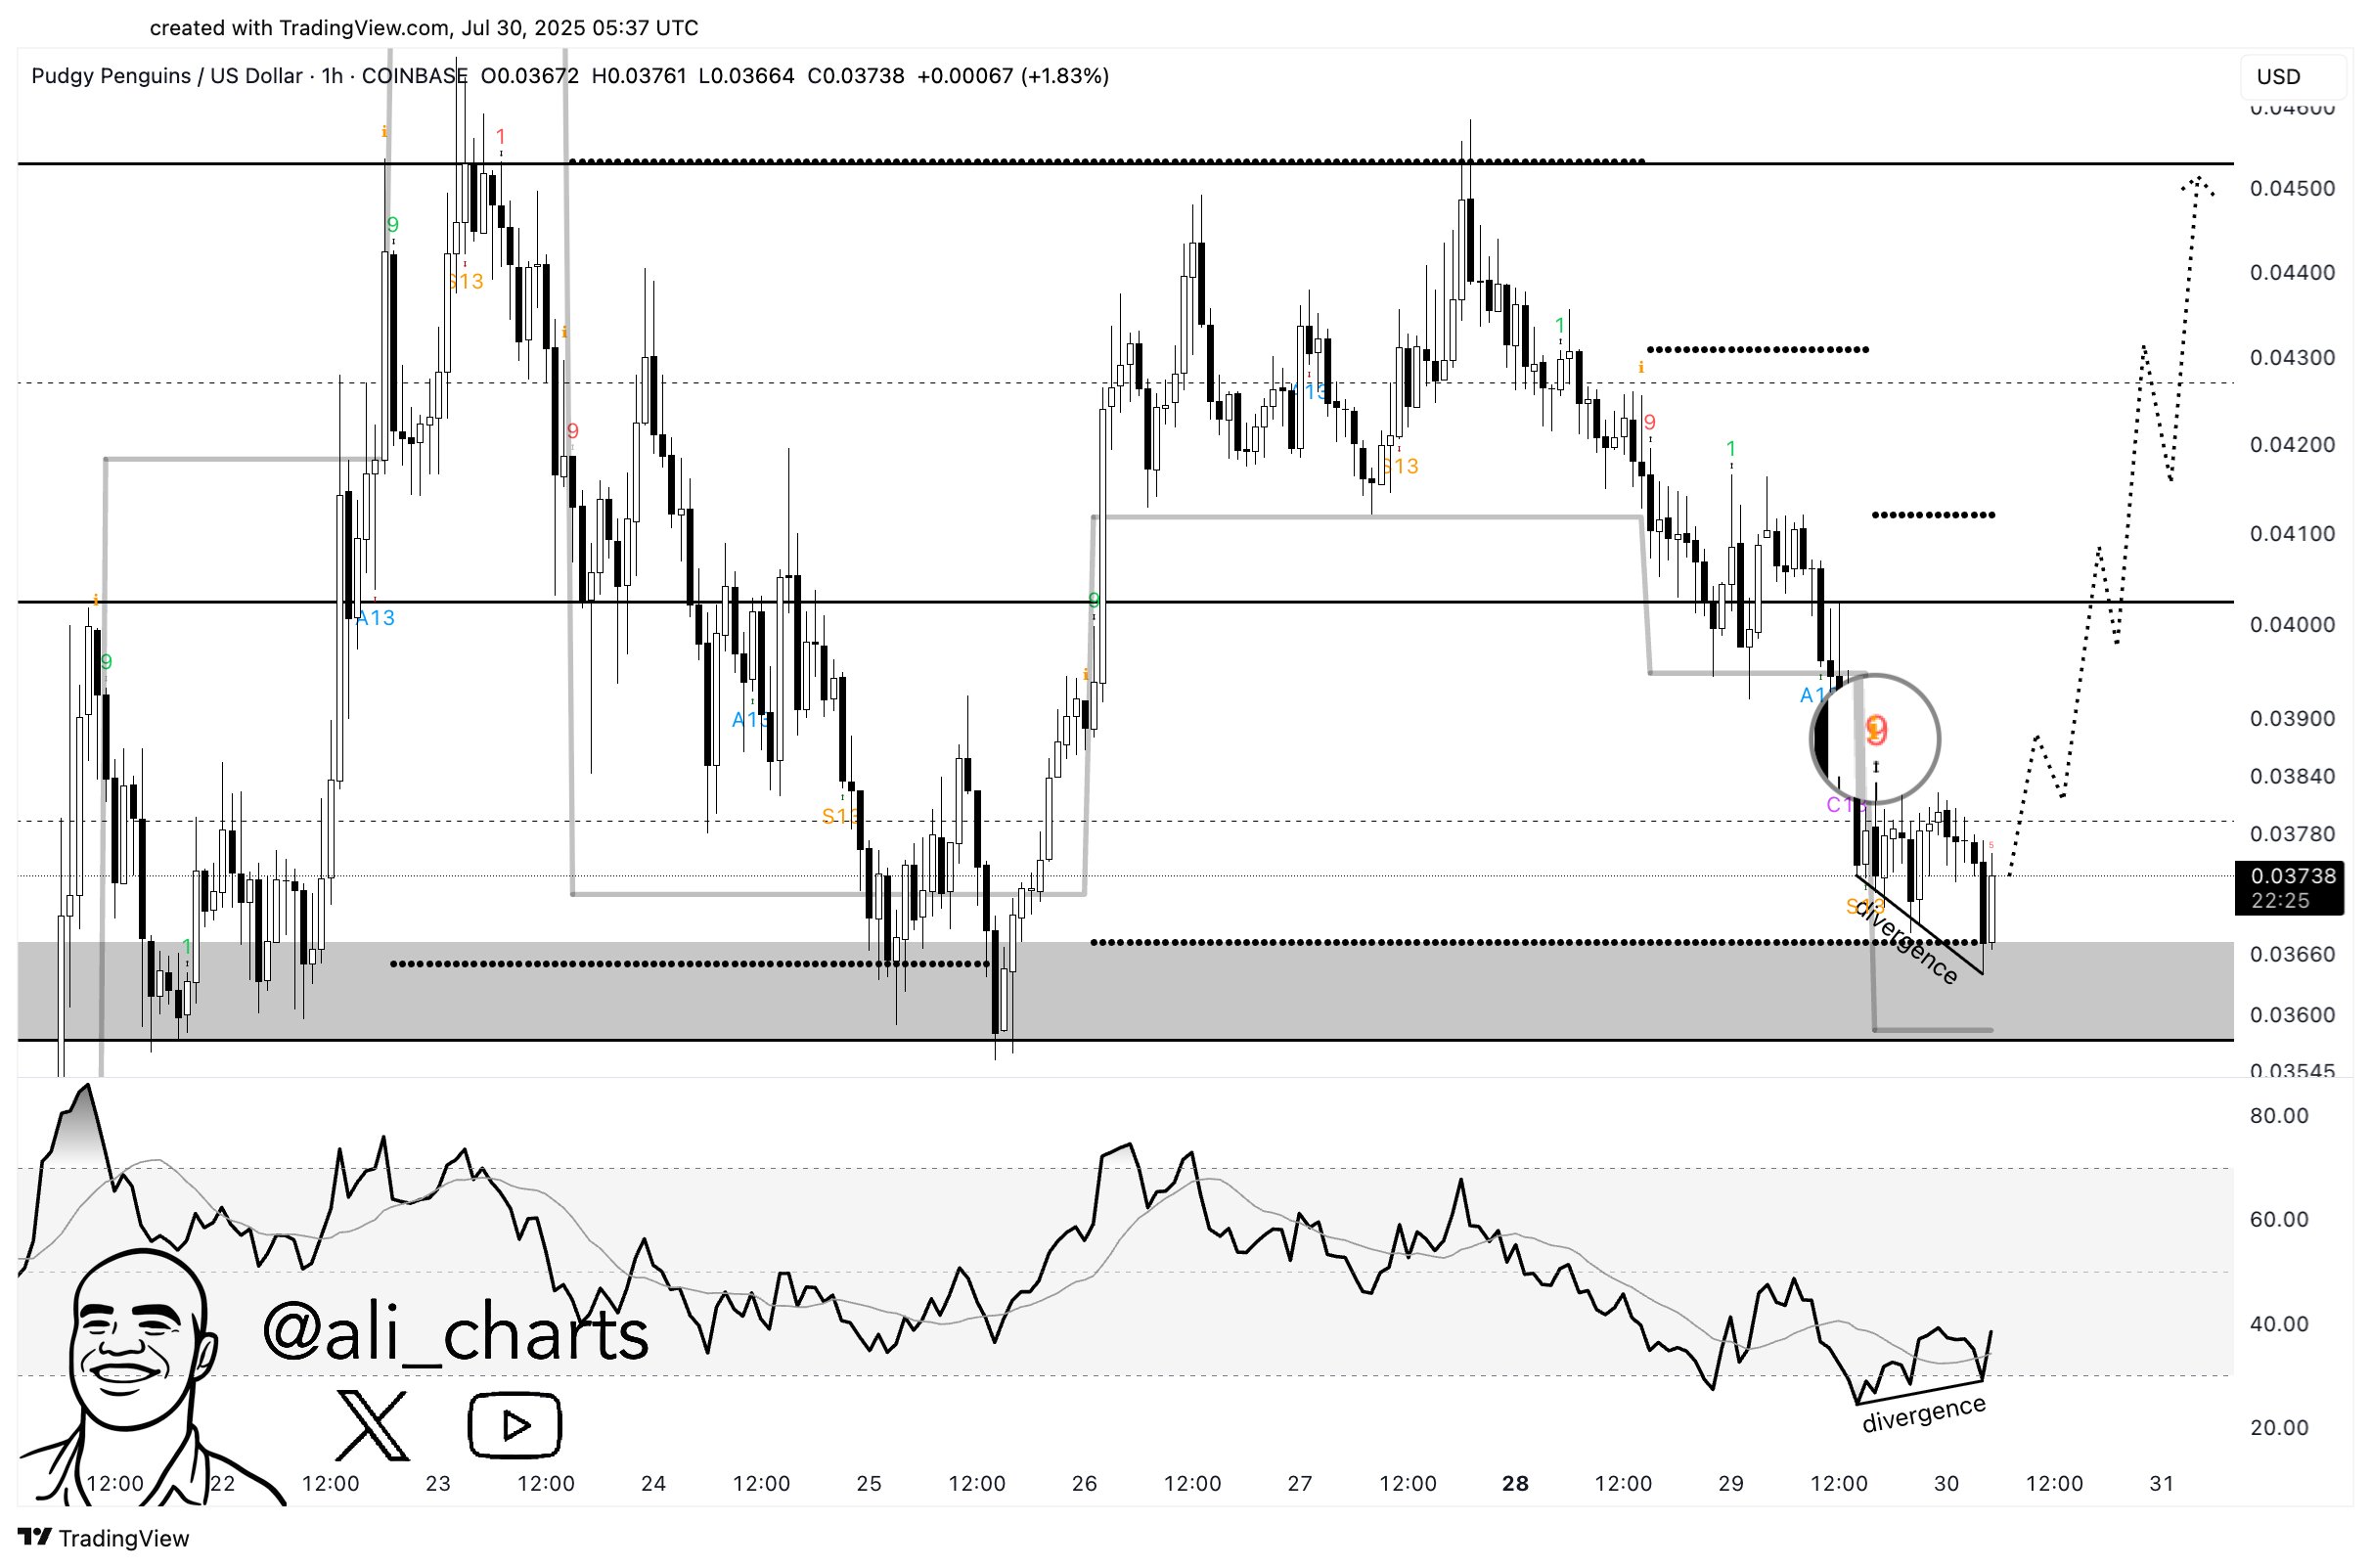
First, the Tom Demark (TD) Sequential has flashed a buy signal for PENGU. The TD Sequential is an indicator that’s used for locating points of probable reversal in any asset’s price. It involves two phases: setup and countdown.
In the first phase, the setup, candles of the same color are counted up to nine, with the ninth candle marking a potential top or bottom for the asset. The countdown picks up where the setup left and goes on for another thirteen candles, before the price is considered to have arrived at another reversal.
The TD Sequential has completed the former type of phase with nine red candles for Pudgy Penguins recently, which indicates that the cryptocurrency may be near or at a bottom.
The second signal forming for the coin is the divergence between its price and its Relative Strength Index (RSI). The RSI keeps track of the speed and magnitude of changes occurring in a given asset.
From the chart, it’s apparent that the metric fell into the area below 30 earlier. This zone corresponds to oversold conditions. It’s also visible, however, that it has since climbed back out of the region while PENGU has continued to decline. Such a divergence is usually considered to be a bullish signal.
Lastly, the cryptocurrency is currently sitting NEAR the support level of a short-term Parallel Channel. This pattern appears whenever an asset’s price consolidates between two parallel trendlines.
There are three different types of Parallel Channels, but the version relevant here involves trendlines that are parallel to the time-axis. That is, the variant where the asset consolidates in an exactly sideways manner.
The lower line of a Parallel Channel is assumed to be a source of support, while the upper one that of resistance. As such, given that PENGU is sliding down toward the bottom line of the pattern currently, it’s possible that it might find a turnaround.
Given all these TA signals, a bullish rebound may be on the cards for the cryptocurrency. “All signs point to liftoff!” notes Martinez. It now remains to be seen how the coin will develop in the coming days.
PENGU Price
At the time of writing, PENGU is floating around $0.037, down 11% in the last seven days.
