Dogecoin Triggers Ultra-Rare Weekly Bull Signal — Top Analyst Goes All-In

Dogecoin just lit up the charts with a bullish signal so uncommon, traders are scrambling to reposition. Here’s why one prominent analyst is doubling down.
### The Signal That Shook Meme Coin Markets
When DOGE’s weekly chart flashed its first bullish indicator in over 18 months, the market took notice. No hype—just cold, hard technicals screaming buy.
### Why Smart Money’s Stacking DOGE Now
Forget the Elon tweets. This surge stems from a textbook breakout pattern even crypto skeptics can’t ignore. The last time this setup appeared? A 300% rally followed.
### The Cynic’s Corner
Of course, Wall Street’s still calling it a ‘joke’—right before they quietly allocate 2% of their hedge fund to ‘digital asset diversification.’
Bottom line: When the charts talk, meme coins walk. And right now, Dogecoin’s sprinting.
This Dogecoin Ichimoku Signal Can’t Be Ignored
The chart he published was captured at 12:46 UTC on July 30 and showed dogecoin (weekly timeframe) trading near $0.216 after a week-to-date decline of 10.23%. TradingView’s readout on the image lists weekly O/H/L/C at 0.24076 / 0.24854 / 0.21440 / 0.21613, alongside Ichimoku values Tenkan-sen 0.21517, Kijun-sen 0.21142, Senkou Span A 0.21329, and Senkou Span B 0.28247.
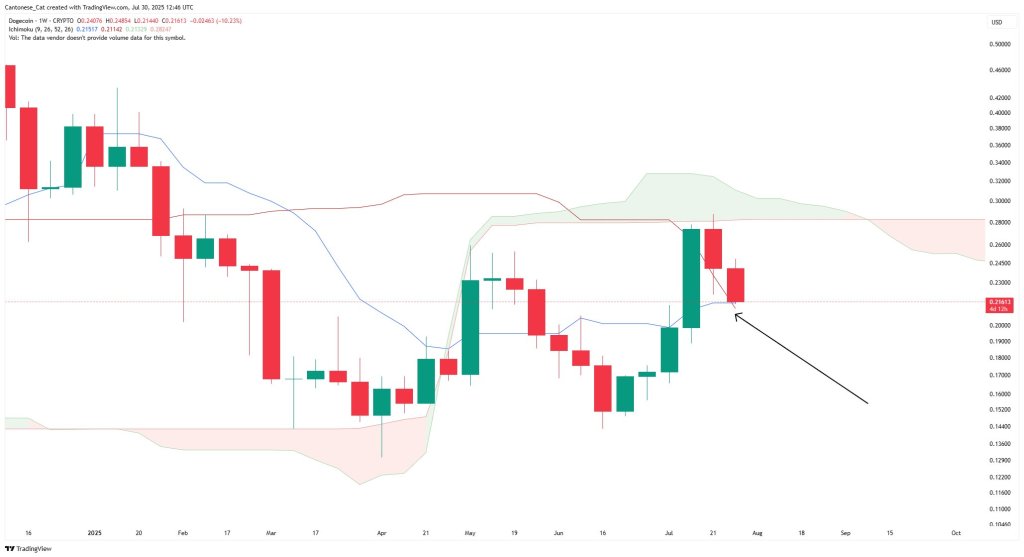
The thrust of the analyst’s call rests on classic Ichimoku mechanics. The Tenkan-sen (conversion line) has crossed above the Kijun-sen (base line) on the weekly chart—an event technicians describe as a bullish Tenkan–Kijun cross. In the posted image, spot price sits marginally above the Tenkan and Kijun, consistent with his comment that price is “finding support at the Tenkan.”
In Ichimoku methodology, the Tenkan often acts as a fast-moving gauge of momentum and, when rising above the slower Kijun, can mark the start of a momentum-led trend attempt. On higher timeframes such as the weekly, participants typically treat those inflections as more consequential than on intraday charts.
That said, the same screenshot shows DOGE trading beneath the weekly cloud (Kumo) projected ahead, with Senkou Span B up NEAR the $0.28 area. In textbook terms, signals that occur below the cloud are generally categorized as weaker than signals that occur above it, even when the Tenkan–Kijun cross is bullish. The image also captures the context of the move: after a forceful green candle in mid-July, two red weekly candles followed, leaving price clustered around the Tenkan/Kijun zone.
Pressed for a status check a day later, the analyst reiterated that the technical picture had not broken down: “DOGE holding weekly Ichimoku Tenkan and Kijun support so far,” he wrote on July 31. That comment underscores how Ichimoku practitioners often judge trend health by whether price can close above the Kijun on the chosen timeframe and continue to respect the Tenkan on pullbacks.
For now, the story is a straightforward one: a bullish Tenkan–Kijun cross on the weekly chart, with price attempting to base at those lines while the cloud overhead still looms as longer-term resistance. As ever with Ichimoku analysis, the coming weekly close relative to the Tenkan and Kijun will be the focal reference for traders tracking whether this early signal can mature into a broader uptrend.
At press time, Doge traded at $0.22.

Log in to Reply
Log in to comment your thoughtsComments
Related Articles
|Square
Get the BTCC app to start your crypto journey
Get started today Scan to join our 100M+ users