Bitcoin’s Recovery Journey: Navigating Heavy Obstacles Ahead

Bitcoin bulls face an uphill battle as multiple resistance levels loom large.
Market Momentum Meets Reality Check
The king of crypto keeps hitting walls on its climb back up—technical barriers, regulatory uncertainty, and institutional hesitation all playing defense. Every rally attempt gets met with selling pressure that'd make even the most optimistic trader wince.
Institutional Players Watching from the Sidelines
Big money isn't jumping in yet—they're waiting for clearer signals while retail investors keep getting whipsawed. The classic 'wait-and-see' approach from suits who still think blockchain is something you need WD-40 for.
Technical Analysis Paints Challenging Picture
Key resistance levels stack up like unpaid invoices at a hedge fund—each one tougher to break than the last. Fibonacci retracements look more like obstacle courses than recovery paths.
Meanwhile traditional finance keeps pretending they invented decentralization—just with more paperwork and higher fees. Because nothing says 'financial revolution' like needing three compliance officers to buy a fraction of a Bitcoin.
Bitcoin Price Finds Support
Bitcoin price started a fresh decline after a close below the $115,500 level. BTC gained bearish momentum and traded below the $113,500 support zone.
There was a MOVE below the $113,000 support zone and the 100 hourly Simple moving average. The pair tested the $112,500 zone. A low was formed at $112,400 and the price is now attempting to recover toward the 23.6% Fib retracement level of the recent decline from the $124,420 swing high to the $112,400 low.
Bitcoin is now trading below $115,000 and the 100 hourly Simple moving average. Immediate resistance on the upside is NEAR the $114,800 level. There is also a key bearish trend line forming with resistance at $114,800 on the hourly chart of the BTC/USD pair.
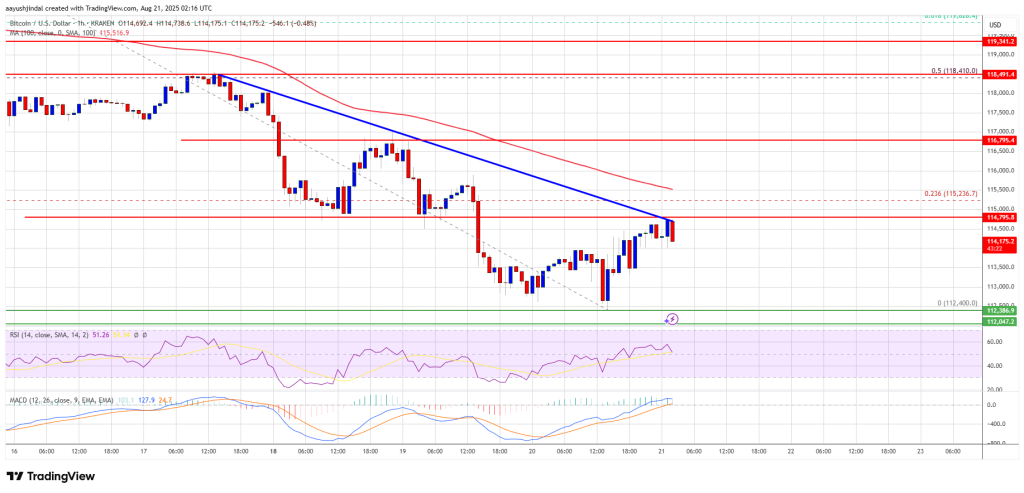
The first key resistance is near the $115,000 level. The next resistance could be $115,500. A close above the $115,500 resistance might send the price further higher. In the stated case, the price could rise and test the $118,400 resistance level. It is close to the 50% Fib retracement level of the recent decline from the $124,420 swing high to the $112,400 low. Any more gains might send the price toward the $120,000 level. The main target could be $121,500.
Another Decline In BTC?
If Bitcoin fails to rise above the $115,000 resistance zone, it could start a fresh decline. Immediate support is near the $113,500 level. The first major support is near the $112,400 level.
The next support is now near the $111,500 zone. Any more losses might send the price toward the $110,000 support in the near term. The main support sits at $108,000, below which BTC might take a major hit.
Technical indicators:
Hourly MACD – The MACD is now losing pace in the bearish zone.
Hourly RSI (Relative Strength Index) – The RSI for BTC/USD is now above the 50 level.
Major Support Levels – $113,500, followed by $111,500.
Major Resistance Levels – $115,000 and $115,500.
