Litecoin (LTC) at a Crossroads: Can It Defend Key Support and Rally to $140?

Litecoin traders brace for turbulence as LTC tests critical support levels—with $140 looming as the next bullish target.
The Silver to Bitcoin's Gold Faces Make-or-Break Moment
LTC's price action mirrors the broader crypto market's schizophrenia—volatility cuts both ways. Bulls cling to the $140 dream, while bears whisper about 'ghost chains' and outdated narratives.
Why This Level Matters
Lose this support, and Litecoin risks becoming another 'remember when' coin. Hold it, and the $140 rally could spark fresh FOMO—because nothing excites bagholders like round-number psychology.
The Punchline
Whether LTC surges or stumbles, one truth remains: in crypto, even 'digital silver' gets treated like a meme stock when Wall Street needs a distraction.

- Litecoin (LTC) shows short-term volatility, testing key support around $101.50 and resistance at $112.25.
- Technical indicators suggest mixed momentum: RSI below midpoint, MACD showing weakening bearish pressure.
- A breakout above $112 could spark an uptrend targeting $140, while falling below $96 risks further declines.
Litecoin is displaying signs of volatility in the short term after establishing a bearish pattern on daily charts. The market is waiting to see if there is a possibility of reversal within key resistance and support zones. A clear breakthrough past the resistance level or support will establish the next momentum upwards.
Litecoin Faces Resistance Near MA Levels
The RSI indicator for Litecoin is currently stuck at 49.78 with weak buying pressure due to the momentum that remains below the midpoint level of 53.30. The MA Ribbons are seen to be mixed due to the 20 SMA that functions as a resistance level at 108.55. The 200 SMA is a strong support, standing at 84.48.
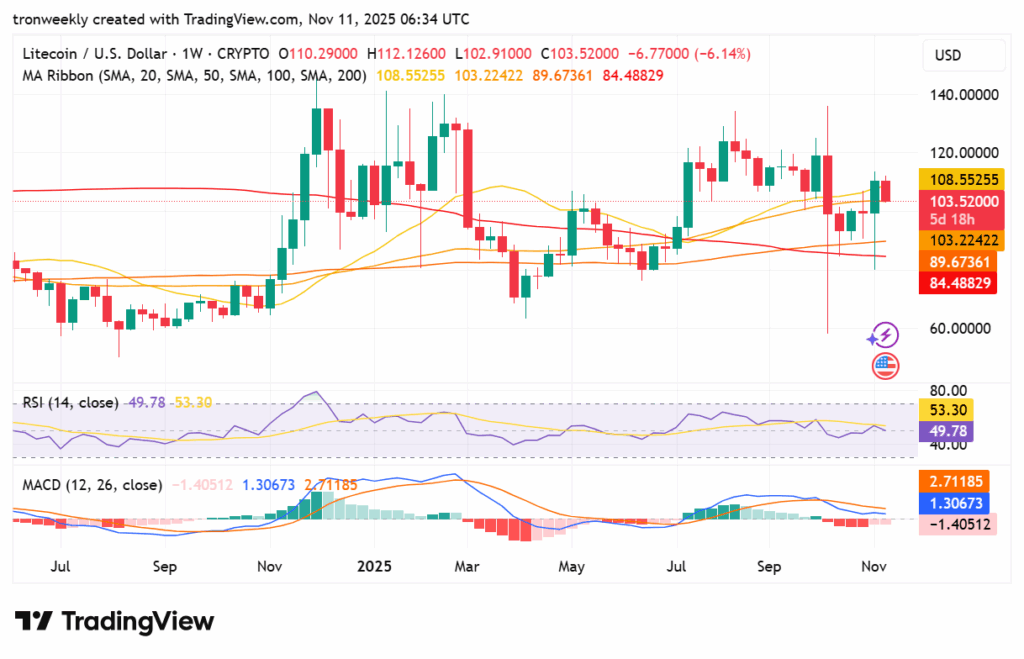
The MACD line (1.30) is below the signal line (2.71), indicating bearish pressure. The histogram depicts weakening red bars, which indicate that the momentum to sell is depleting. A possible bullish reversal may occur if the MACD line surpasses the signal line in the forthcoming days.
At the time of writing, Litecoin is trading at $103.59, with a 24-hour trading volume of $5.69 billion and a market capitalization of $7.93 billion. Over the past 24 hours, LTC has dropped by 4.39%, reflecting some market uncertainty.
Litecoin Faces Bearish Pullback Before Uptrend
A crypto analyst, CRYPTOWZRD, pointed out that Litecoin recently closed in a bearish signal, as was anticipated in the LTCBTC pair after making a double top formation. The crypto analyst pointed out that further swings are to be anticipated in the forthcoming sessions.
A turning-point movement from the $101.50 level will be essential to ensure that further bullish movement begins. A break past $112.25 may indicate the start of an uptrend.
The daily charts of Litecoin and LTCBTC ended with a bearish closure yesterday and thereby supported the decline to confirm the pullback within the double-top formation.
Nevertheless, there is still potential to move further lower to break out and steer LTC higher. If LTC is capable of staying above $112, then the subsequent aim WOULD be $140. Yet below $96 means testing essential levels.
Litecoin Intraday Highlights Key Levels
In intraday charts, volatility is still notable. Breaking above the resistance level of $112.25 may be a good buying opportunity. A similar test below $101.50 with a bullish reversal may also be an ideal trading opportunity.
Analysts believe that investors need to wait until there is a clear formation in charts before making key trades to get the best trade opportunity.
Investors and enthusiasts are advised to take note of these levels of support and resistance to be able to assess the next possible movement for Litecoin.
