XRP Nears Critical Support Level—Long-Term Fibonacci Targets $5 to $11 Rally

XRP teeters on the edge of a make-or-break price floor as Fibonacci projections paint a bullish long-term picture.
The Setup:
After months of sideways action, XRP’s chart shows it’s flirting with a major support zone. Break below? Bears take control. Hold? Bulls get ammunition for a run.
The Fibonacci Roadmap:
Long-term Fibonacci retracement levels—those magical lines traders swear by—suggest a potential surge to $5–$11 if key resistance breaks. Of course, this assumes crypto markets don’t do their usual trick of ‘fakeout followed by brutal liquidation.’
Why It Matters:
XRP’s been the ‘almost’ coin for years—always promising, rarely delivering. But if it cracks this Fibonacci code, even the skeptics might have to pay attention. Or, you know, it could just be another chart pattern that gets rug-pulled by a whale with a sense of humor.
Bottom Line:
Watch the support. If it holds, the $5–$11 zone becomes the next battleground. If not? Well, there’s always the next ‘generational buying opportunity’—until there isn’t.
- XRP is nearing major weekly support after slipping into a corrective trend.
- Indicators such as the RSI and MACD show weakening momentum with room for further downside.
- Long-term Fibonacci levels still point toward $5 to $11 if market structure recovers.
XRP is still trading under pressure because its weekly framework is passing through a correctional period. It has fallen to around $2.25, and this amounts to a fall of about 4.5%.
The market is experiencing a lack of ability to hold up to any FORM of strong upside movement. This withdrawal came soon after the mid-2025 breakout disappeared, and bulls were unable to recover.
One of the biggest worries is that XRP is trading lower than its major moving averages on a weekly basis. The 20-week EMA is at a level of $2.62, the 50-week EMA is at $2.34, and the 100-week EMA is at about $1.85.
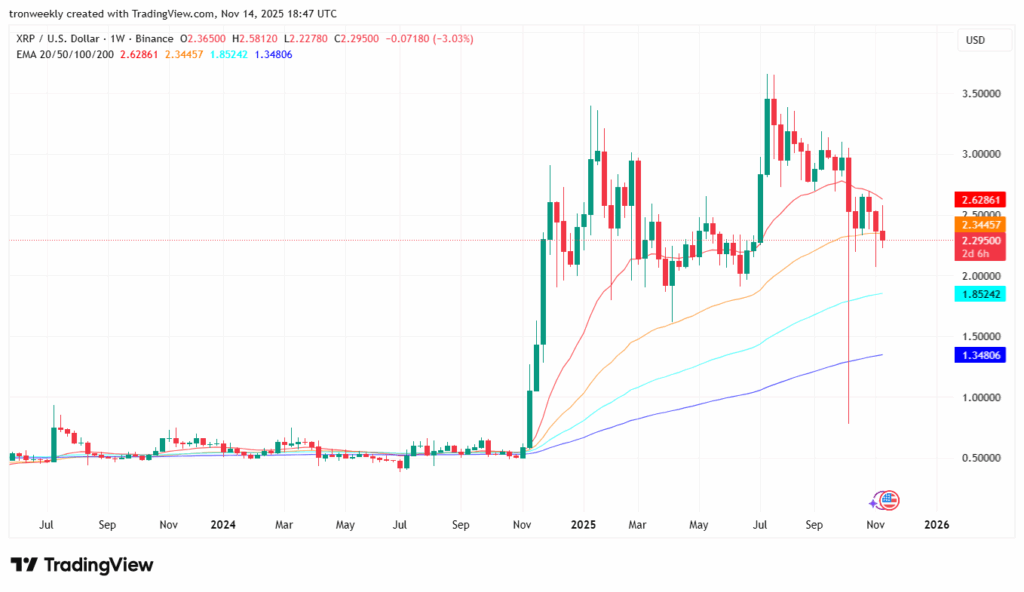
The index being below these levels is an indication that the short-term and mid-term momentum is in the hands of the sellers, who still dictate the market speed.
Both of the attempts to climb up once again above the 20-week and 50-week EMAs have been weakened before hitting any meaningful resistance.
XRP Weakens as Price Nears $2.05 Support
XRP has recently tumbled to the point of 0.618 Fibonacci retracement of around $2.29, a point that at an earlier stage attracted the attention of buyers. In this instance, follow-through is minimal.
There is a greater support zone that is a little lower at the 0.786 Fibonacci level at $2.05. This has been a ground in previous accumulation periods, and it is one of the most important lines that the bulls have to hold.
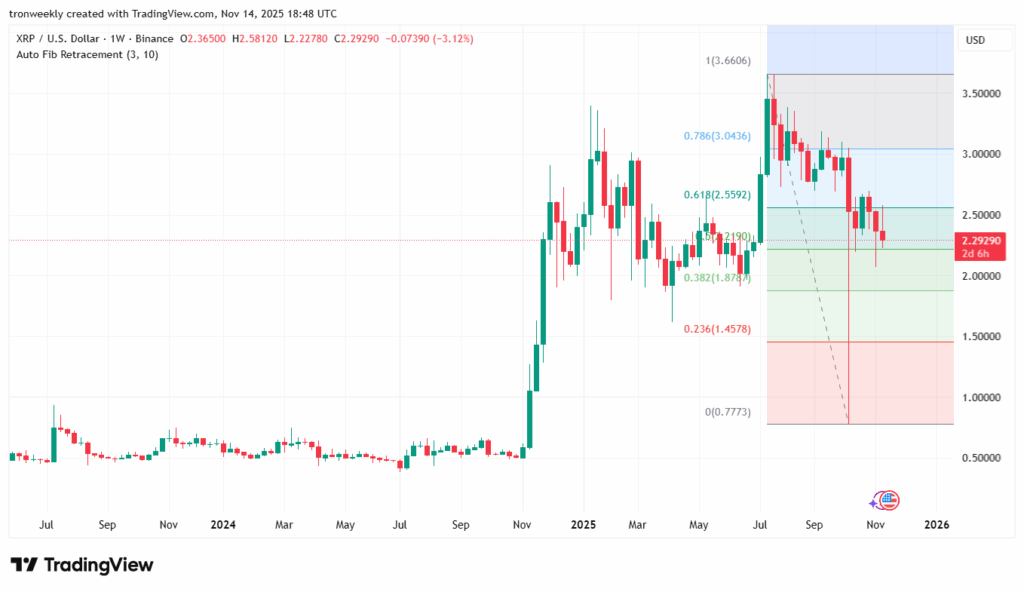
When the price goes below the range of $2.20-$2.05, then the next structural support is indicated in the chart as $1.35. This level relates to consolidation zones that have occurred previously and is congruent with the lower cluster of weekly EMAs.
A decline to this level WOULD verify the further correction and further the sideways trend that has been prevalent in recent months.
Momentum hints provide additional forewarnings. The RSI stands at 43, moving in the bearish region with still more margin of loss. This can be seen in that it was not able to regain its position above the midpoint at 50.
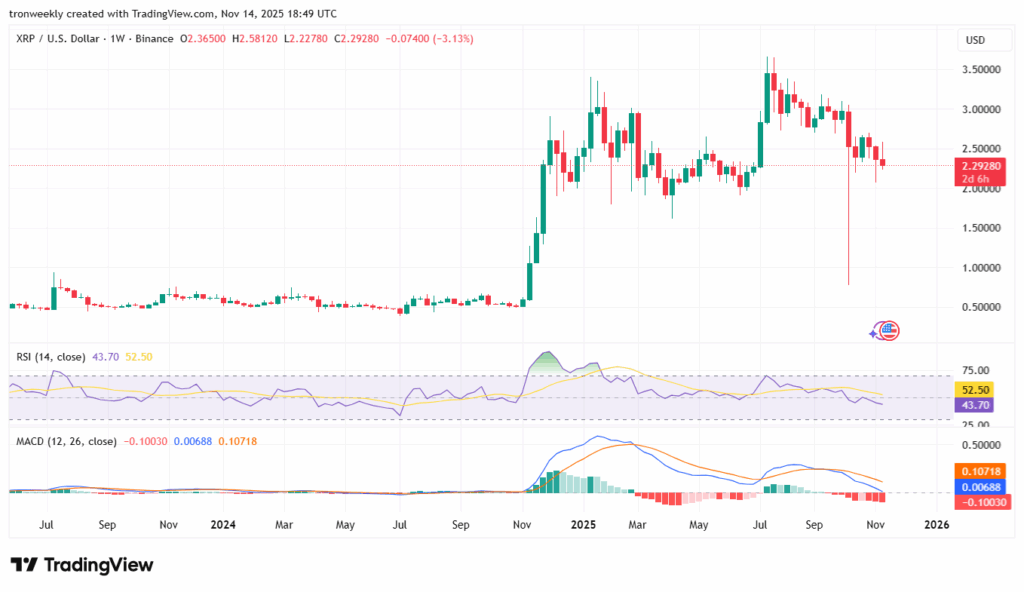
Simultaneously, the MACD has a negative crossover, and the histogram indicates growing bars in red. This trend demonstrates the weakening and shows that the market might stay in the consolidation state before any significant turnaround is created.
Long-Term Fib Targets Still Point Higher
Although XRP is trapped under the summer peak of just under $3.60, bigger Fibonacci estimates show the long-term opportunities. The 1.618 extension hits $5.44, the 2.618 level is projected at $8.32, and the 3.618 extension is projected at $11.29.
Such levels hold the assumption that XRP will stabilize and ultimately hit an impulsive stage as the market at large matures by 2026.
Market analyst EGRAG crypto reported that most traders are becoming cautious following months of sideways trading, but he is highly optimistic in the long term.
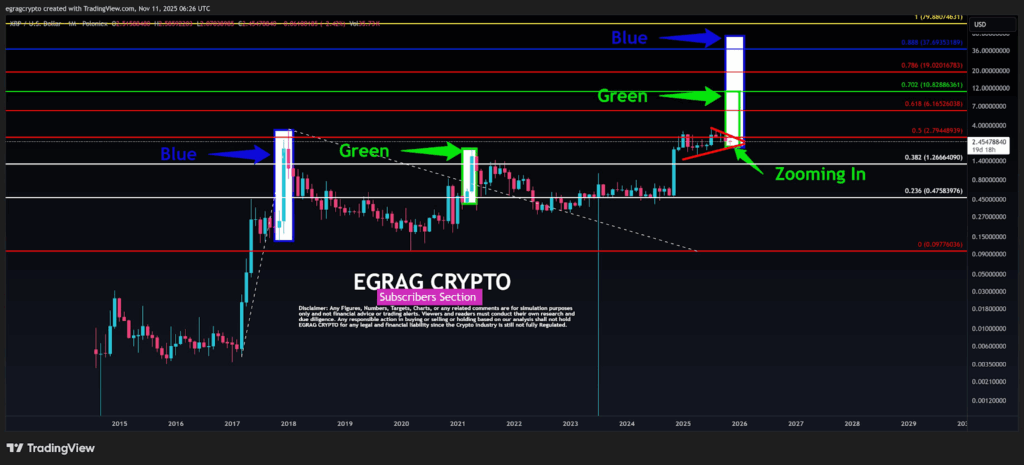
He indicated that past robust periods usually came unexpectedly as candles were generated very fast within a narrow period.
His projection implies that we have not reached the end of historical trends yet, which could potentially provide a bigger wave upon the end of this compression.
