Ethereum at Critical Juncture: ETF Inflows Battle Bearish Technical Signals

Ethereum's price action is stuck in a tug-of-war. On one side, surging ETF inflows are pouring fresh capital into the market. On the other, classic chart patterns are flashing warning signs that have traders on edge.
The ETF Effect: A Wall Street Tailwind
Institutional money is talking. The steady drumbeat of capital into spot Ethereum ETFs is providing a fundamental floor that wasn't there a year ago. It's a structural shift—real dollars chasing real assets, bypassing the old speculative frenzy. This isn't your cousin's crypto gamble; it's asset allocation with a ticker symbol, complete with the usual management fees that would make a traditional banker blush.
Chart Storm Clouds Gathering
Meanwhile, the charts tell a different story. Key resistance levels are holding firm. Momentum indicators are struggling to break into bullish territory. It's a classic technical setup that, in any other market, would have analysts predicting a pullback. The battle lines are drawn between the cold logic of the tape and the hot money from new financial products.
The Verdict: Who Wins the Fight?
So, which force prevails? The new institutional demand or the old technical gravity? History suggests money flow trumps chart patterns in the short run—until it doesn't. For now, Ethereum sits at a turning point, caught between Wall Street's latest product and the market's timeless rhythms. The only certainty is volatility, proving once again that in finance, every 'innovation' just finds new ways to keep your portfolio interesting.
TLDR
- ETH dominance rebounds near 13%, a level historically linked to major cycle bottoms
- Head and shoulders breakdown targets a potential dip toward the $2,400 zone
- Ethereum ETF inflows signal institutional accumulation despite price weakness
- Market balance hinges on reclaiming $2,899 or defending support amid volatility
Ethereum price is approaching a decisive phase as conflicting technical and fundamental signals shape the near-term outlook. While short-term charts warn of downside risk toward the $2,400 region, longer-term dominance metrics and rising ETF inflows suggest underlying demand remains intact. Analysts now view the market as balanced between corrective pressure and potential recovery catalysts.
Ethereum Dominance Stabilizes After Prolonged Decline
According to analyst Gordon’s weekly Ethereum dominance chart, ETH’s share of the total crypto market has declined steadily from above 20% to near 14%. This drop reflected repeated altcoin rotations and periods of strong Bitcoin dominance. However, recent price action shows dominance rebounding from the 13% horizontal support zone, a zone historically associated with major cycle bottoms.

Moreover, volume behavior during recent dips points to defensive accumulation rather than capitulation. ethereum dominance has previously rebounded from similar levels during network upgrades and periods of institutional inflows. If the downtrend breaks, analysts expect a reclaim of the 16% to 18% range, with an extension toward 20% possible on confirmation.
That said, risk remains if Bitcoin continues to outperform the wider crypto market. Sustained strength in Bitcoin dominance could limit Ethereum’s recovery and delay any altcoin expansion. For now, dominance consolidation suggests downside momentum may be slowing.
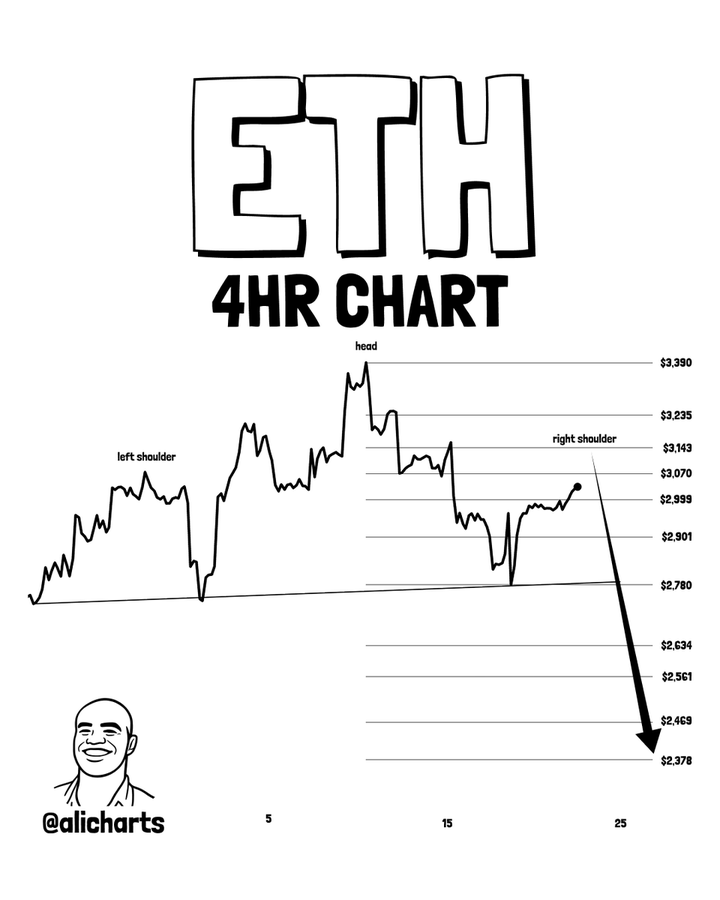
Ethereum Price Faces Head and Shoulders Breakdown Risk
Meanwhile, according to analyst Ali, the short-term ethereum price structure shows a completed head and shoulders pattern on the four-hour timeframe. The formation developed with a neckline near $2,899, which was decisively broken. Volume expansion during the breakdown confirmed short-term seller control.
SOURCE: X
As a result, measured move projections from the pattern point toward a potential decline NEAR $2,400. Previous resistance levels at $3,099 and $3,235 now act as overhead barriers, likely capping any recovery attempts. Unless price reclaims the neckline, bearish pressure may persist.
However, analysts also noted that head and shoulders patterns can lose validity if reclaimed quickly. A sustained close back above $2,899 WOULD weaken the bearish case and shift focus toward stabilization around $2,700. Until then, downside risks remain elevated.
ETF Inflows Provide Fundamental Support for ETH
In contrast to bearish chart signals, institutional data presents a more supportive narrative. According to Ted Pillows, Ethereum ETF flows have remained net positive during several sessions in December. Grayscale’s ETHE accounted for the majority of inflows, including a single-day purchase of $84.6 million.

SOURCE: X
Additionally, cumulative inflows reached $177.7 million earlier in the month, highlighting continued institutional engagement despite price volatility. These inflows suggest longer-term investors are accumulating during weakness, potentially absorbing sell-side pressure. Analysts suggest that ETF demand has often acted as a stabilizing force during corrective phases.
Still, flows remain inconsistent across providers, with fee structures and staking uncertainty influencing allocations. If sustained inflows continue, Ethereum could find support near current levels and attempt a MOVE back toward the $3,000 zone. Without consistency, ETF demand alone may not be sufficient to offset broader market weakness.
Ethereum price remains at a technical crossroads. Short-term charts signal caution, while longer-term dominance trends and ETF inflows point to underlying resilience. The next directional move will likely depend on whether buyers can defend key levels as institutional participation continues to evolve.
