Dogecoin Price Analysis: Bullish Reversal Patterns Signal Potential Surge to $0.16

Dogecoin flashes its first serious buy signal in months—technical patterns suggest the meme coin could be waking from its slumber.
Breaking the Pattern
A textbook bullish reversal is forming on the charts. Key resistance levels that have capped rallies for weeks are now being tested. The setup points toward a clear technical path upward if momentum holds.
The $0.16 Target
Analysts are eyeing the $0.16 mark—a level not seen since the last retail frenzy. The math comes straight from the chart's geometry, not hopeful speculation. It represents a significant upside from current prices, offering a concrete benchmark for the rally.
Why This Time Feels Different
Volume is confirming the price action—a critical detail often missing in Dogecoin's dead-cat bounces. This isn't just another social media pump; the market structure itself is shifting. Of course, in crypto, 'market structure' sometimes just means enough people forgot they got burned last time.
The Meme Trade Returns?
If Dogecoin clears these technical hurdles, it could reignite the entire meme coin sector. Traders are watching closely—a successful breakout here would signal risk appetite is back, for better or worse. Just remember: past performance is no guarantee of future results, especially when the asset's fundamentals include a Shiba Inu mascot and tweets from billionaires.
One cynical finance jab: Traditional analysts watching this unfold are probably muttering about 'greater fool theory' over their spreadsheets—while secretly checking their own crypto portfolios.
TLDR
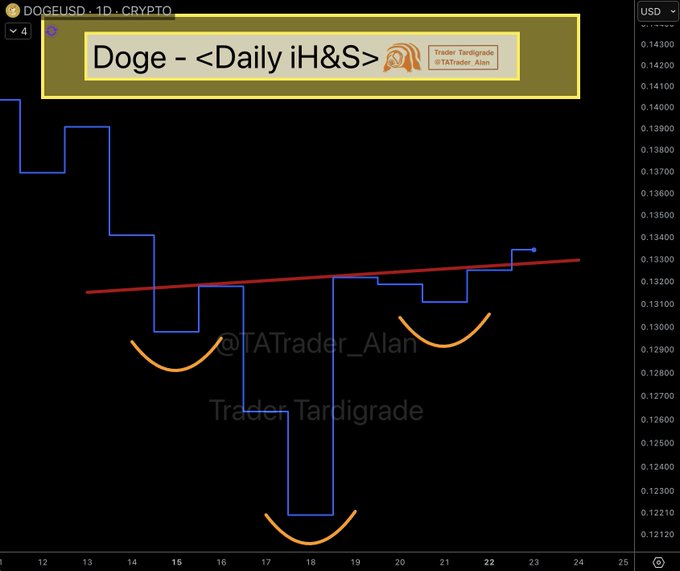
- Inverse head and shoulders suggest a potential Dogecoin trend reversal.
- A break above $0.135 could validate upside toward $0.15–$0.16.
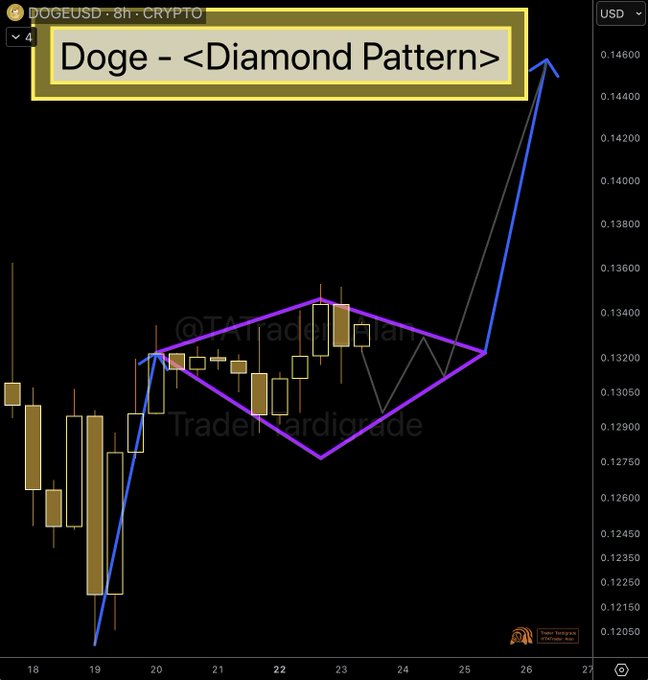
- The diamond continuation pattern favors a bullish resolution after consolidation.
- Liquidity sweep below $0.13 hints at seller exhaustion and accumulation.
Dogecoin (DOGE) price is showing early signs of a potential trend reversal as several bullish chart formations emerge across multiple timeframes. Technical analysts note improving structure and fading selling pressure following weeks of consolidation NEAR key support. If confirmation levels are reclaimed, upside targets toward the $0.15–$0.16 zone are increasingly coming into focus.
Dogecoin Price Inverse Head and Shoulders Signals Trend Reversal
According to Trader Tardigrade, the daily Dogecoin chart is forming a clear inverse head and shoulders pattern, a structure often associated with bullish reversals. The formation developed with the head near recent lows around $0.1250 and shoulders forming close to $0.1320. This symmetry highlights a gradual shift from selling pressure to accumulation.
SOURCE: X
Moreover, the neckline sits near $0.1350, acting as the key confirmation level for the pattern. A daily close above this resistance WOULD validate the setup and suggest a reversal is underway. Volume expansion on the right shoulder adds credibility, as rising participation often precedes breakouts in sentiment-driven assets.
If confirmed, the measured move projection places initial targets between $0.1450 and $0.1500. In extended scenarios, momentum could push Dogecoin price toward $0.1600. However, a breakdown below the head low would invalidate the pattern and return focus to downside risks.
Diamond Continuation Pattern Points to Upside Resolution
Meanwhile, on the eight-hour timeframe, Tardigrade highlighted a diamond continuation pattern forming after a prior upward move. This structure reflects expanding volatility followed by compression, often preceding a trend continuation. Price has been oscillating within the diamond boundaries near the $0.1300 region.
SOURCE: X
Additionally, volume contraction inside the formation suggests energy is building for a decisive move. Diamond patterns typically resolve in the direction of the prevailing trend, which in this case favors the upside. Analysts therefore view the current compression as a constructive pause rather than a distribution phase.
If an upside breakout occurs, projected targets sit around $0.1400 to $0.1450, based on the pattern’s height. A failure to hold the lower boundary would weaken the bullish bias, though the current structure continues to favor continuation. External factors, including broader market sentiment, may influence timing.
Liquidity Sweep and Base Formation Support Recovery
Furthermore, analyst BitGuru’s daily analysis points to a bullish cup-like base forming after a notable liquidity sweep below $0.13. This MOVE cleared weak hands before price stabilized above support, a behavior commonly seen ahead of recoveries. Selling volume has since faded, suggesting exhaustion among sellers.

In addition, price is now defending the $0.13 zone, which aligns with historical demand zones. This stabilization phase indicates accumulation rather than renewed distribution. The rounded structure highlights improving market balance following the prior downtrend.
If buyers reclaim the $0.15 to $0.16 region, overhead liquidity could be filled quickly. Such a move would confirm the base and open the door for higher resistance tests. Failure to hold current support, however, would delay recovery and reintroduce downside pressure.
