Solana Price Targets $425 as Monthly Chart Reveals Explosive Bullish Pattern

Solana's technical setup screams bullish as monthly chart patterns point toward a potential surge to $425.
The Technical Breakout
SOL's monthly chart flashes a classic bullish formation that historically precedes major price movements. The pattern's confirmation could trigger a wave of institutional buying and retail FOMO.
Market Momentum Builds
Traders are positioning for what could be Solana's next major leg up. The $425 target represents a significant psychological barrier that, if broken, could open the path to new all-time highs.
Of course, in crypto land, technical analysis works perfectly—until it doesn't. But for now, the charts are telling a story that bulls want to hear.
 Source: TradingView
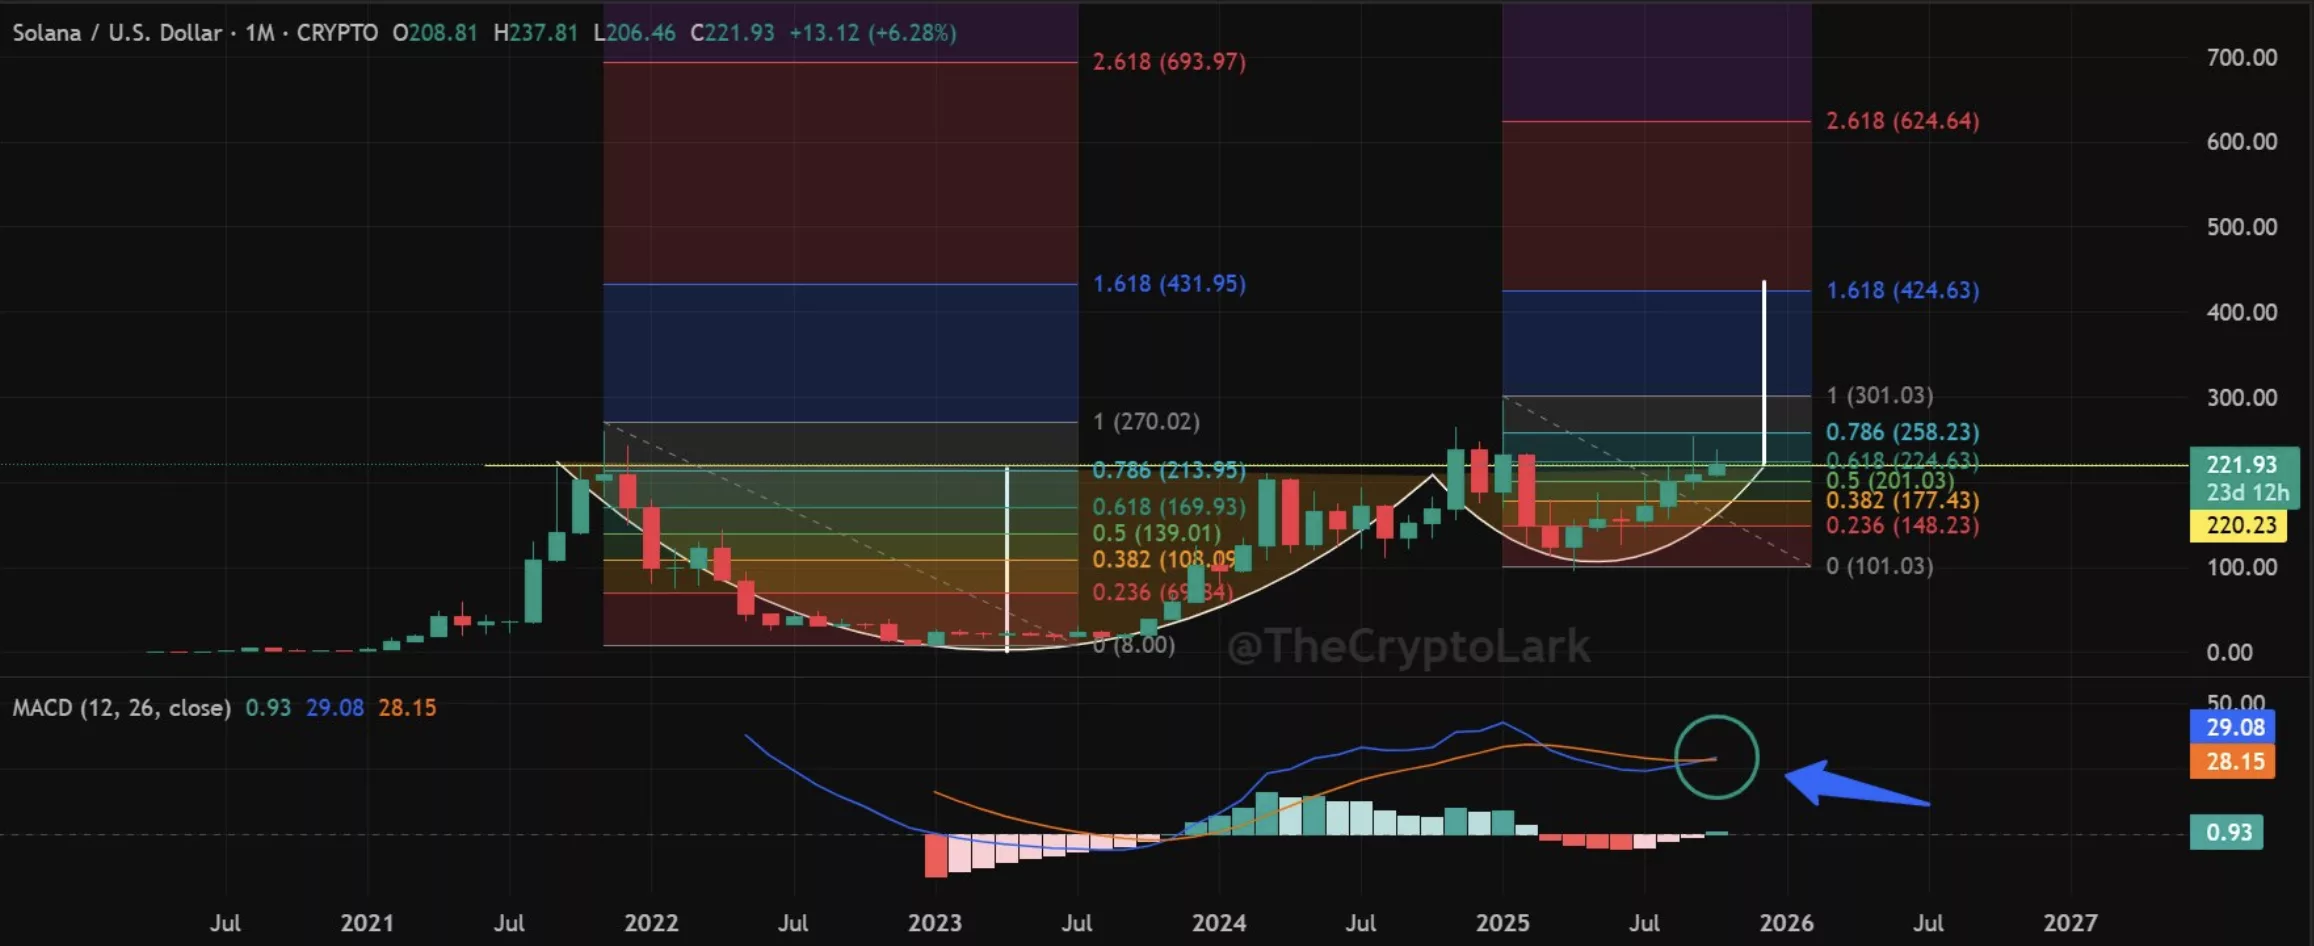
Solana price eyes $425 target
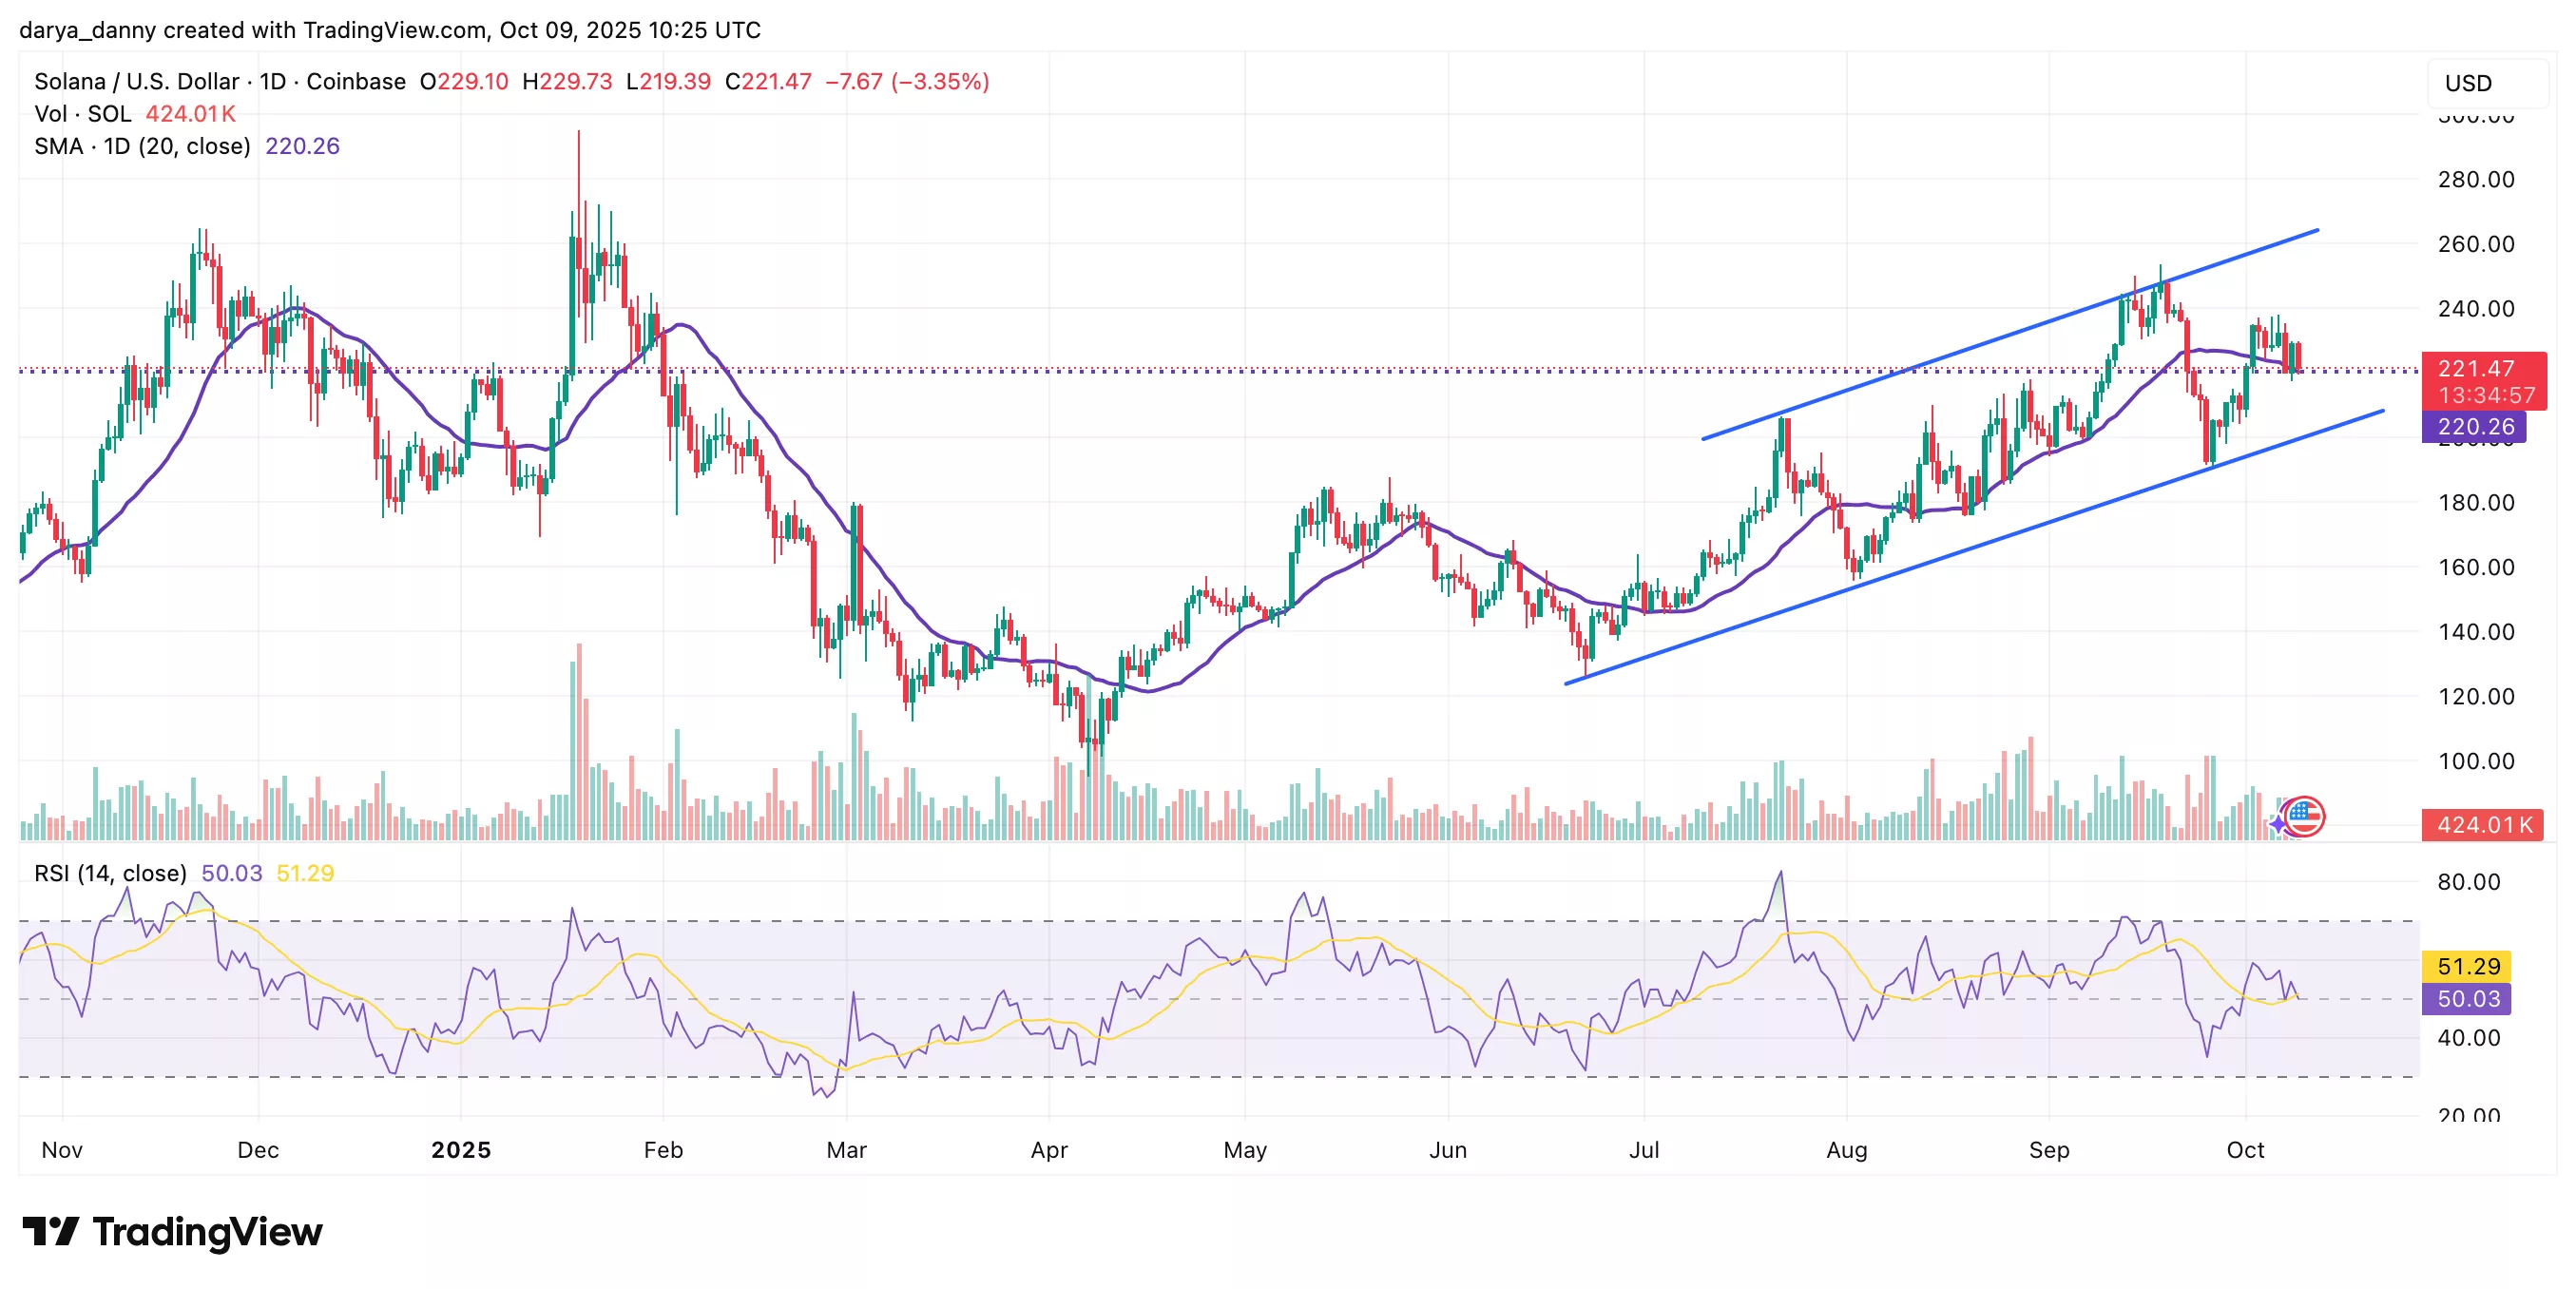
While the near-term target remains around $253, there is potential for a much larger breakout if macro conditions align.
On the monthly timeframe, solana price action appears to be forming a textbook cup-and-handle pattern — a bullish setup that, if confirmed, could mark the beginning of a new macro uptrend for SOL. The pattern’s breakout aligns closely with the 1.618 Fibonacci extension level, which sits around $425.
Additionally, the monthly MACD has just flashed a golden cross, with the MACD line crossing above the signal line, indicating a potential shift in long-term momentum from bearish to bullish and reinforcing the case for a run towards the $425 target.