Bitcoin Plunges Below $113K — Historic 10-Year Supply Squeeze Ignites Recovery Hopes

Bitcoin's foundation just got rocked—but the tremors might signal something bigger brewing beneath the surface.
Supply Shock Looms
Exchange reserves hit their lowest point in a decade, bleeding out while traditional finance experts scratch their heads. This isn't just a dip—it's a structural shift playing out in real-time.
Whales are circling, accumulation patterns are emerging, and the market's priming for a rebound that could leave skeptics eating digital dust. Because when supply dries up and demand holds steady, basic economics does the rest—even if Wall Street still thinks blockchain is something you use to secure your bicycle.
The stage is set for a recovery that could rewrite the rulebook. Again.
Bitcoin exchange reserves hit 10-year low
According to an Oct. 14 analysis by CryptoQuant contributor Chairman Lee, the amount of Bitcoin (BTC) stored on centralized exchanges has dropped to around 2.4 million BTC, the lowest level since 2015. In 2020, that figure was more than 3.5 million BTC. The steady decline marks one of the most consistent withdrawal trends in Bitcoin’s history.
Lee notes that when fewer coins are available for trading, selling pressure tends to ease. Historically, such periods of shrinking supply have often come before major rallies, as seen in 2020 and 2021.
This pattern suggests that while prices may appear weak in the short term, the underlying structure remains strong. As long-term holders, institutional investors, and exchange-traded funds continue to transfer bitcoin into regulated custody and cold wallets, Bitcoin’s supply will tighten even further.
Post-liquidation reset could fuel next rally
Another analysis by XWIN Research Japan compares recent liquidations with previous periods of recovery. Following news of new U.S.-China tariffs, leveraged positions worth about $19 billion were wiped out on Oct. 10. Bitcoin briefly dropped to $104,000 before stabilizing.
History shows that large liquidation events, such as those in 2021, often reset the market rather than sabotage it. When leverage clears out, spot demand usually returns, and prices recover.
This time, ETF inflows, institutional demand, and lower exchange balances suggest the same story is unfolding again. On-chain data shared by XWIN Research Japan backs this up. Funding rates have normalized, and the aSOPR, a key profitability ratio, has moved above 1.0, indicating a shift from panic to accumulation.
What looks like weakness now could be the beginning of a rebuilding phase, as has happened after every major flush in Bitcoin’s history.
Bitcoin price technical analysis
Bitcoin remains in a cautious zone. At 44, the relative strength index indicates neutral momentum. The majority of short-term moving averages (10 to 50 days) indicate mild selling pressure, while momentum and MACD indicators have a slightly bearish bias.
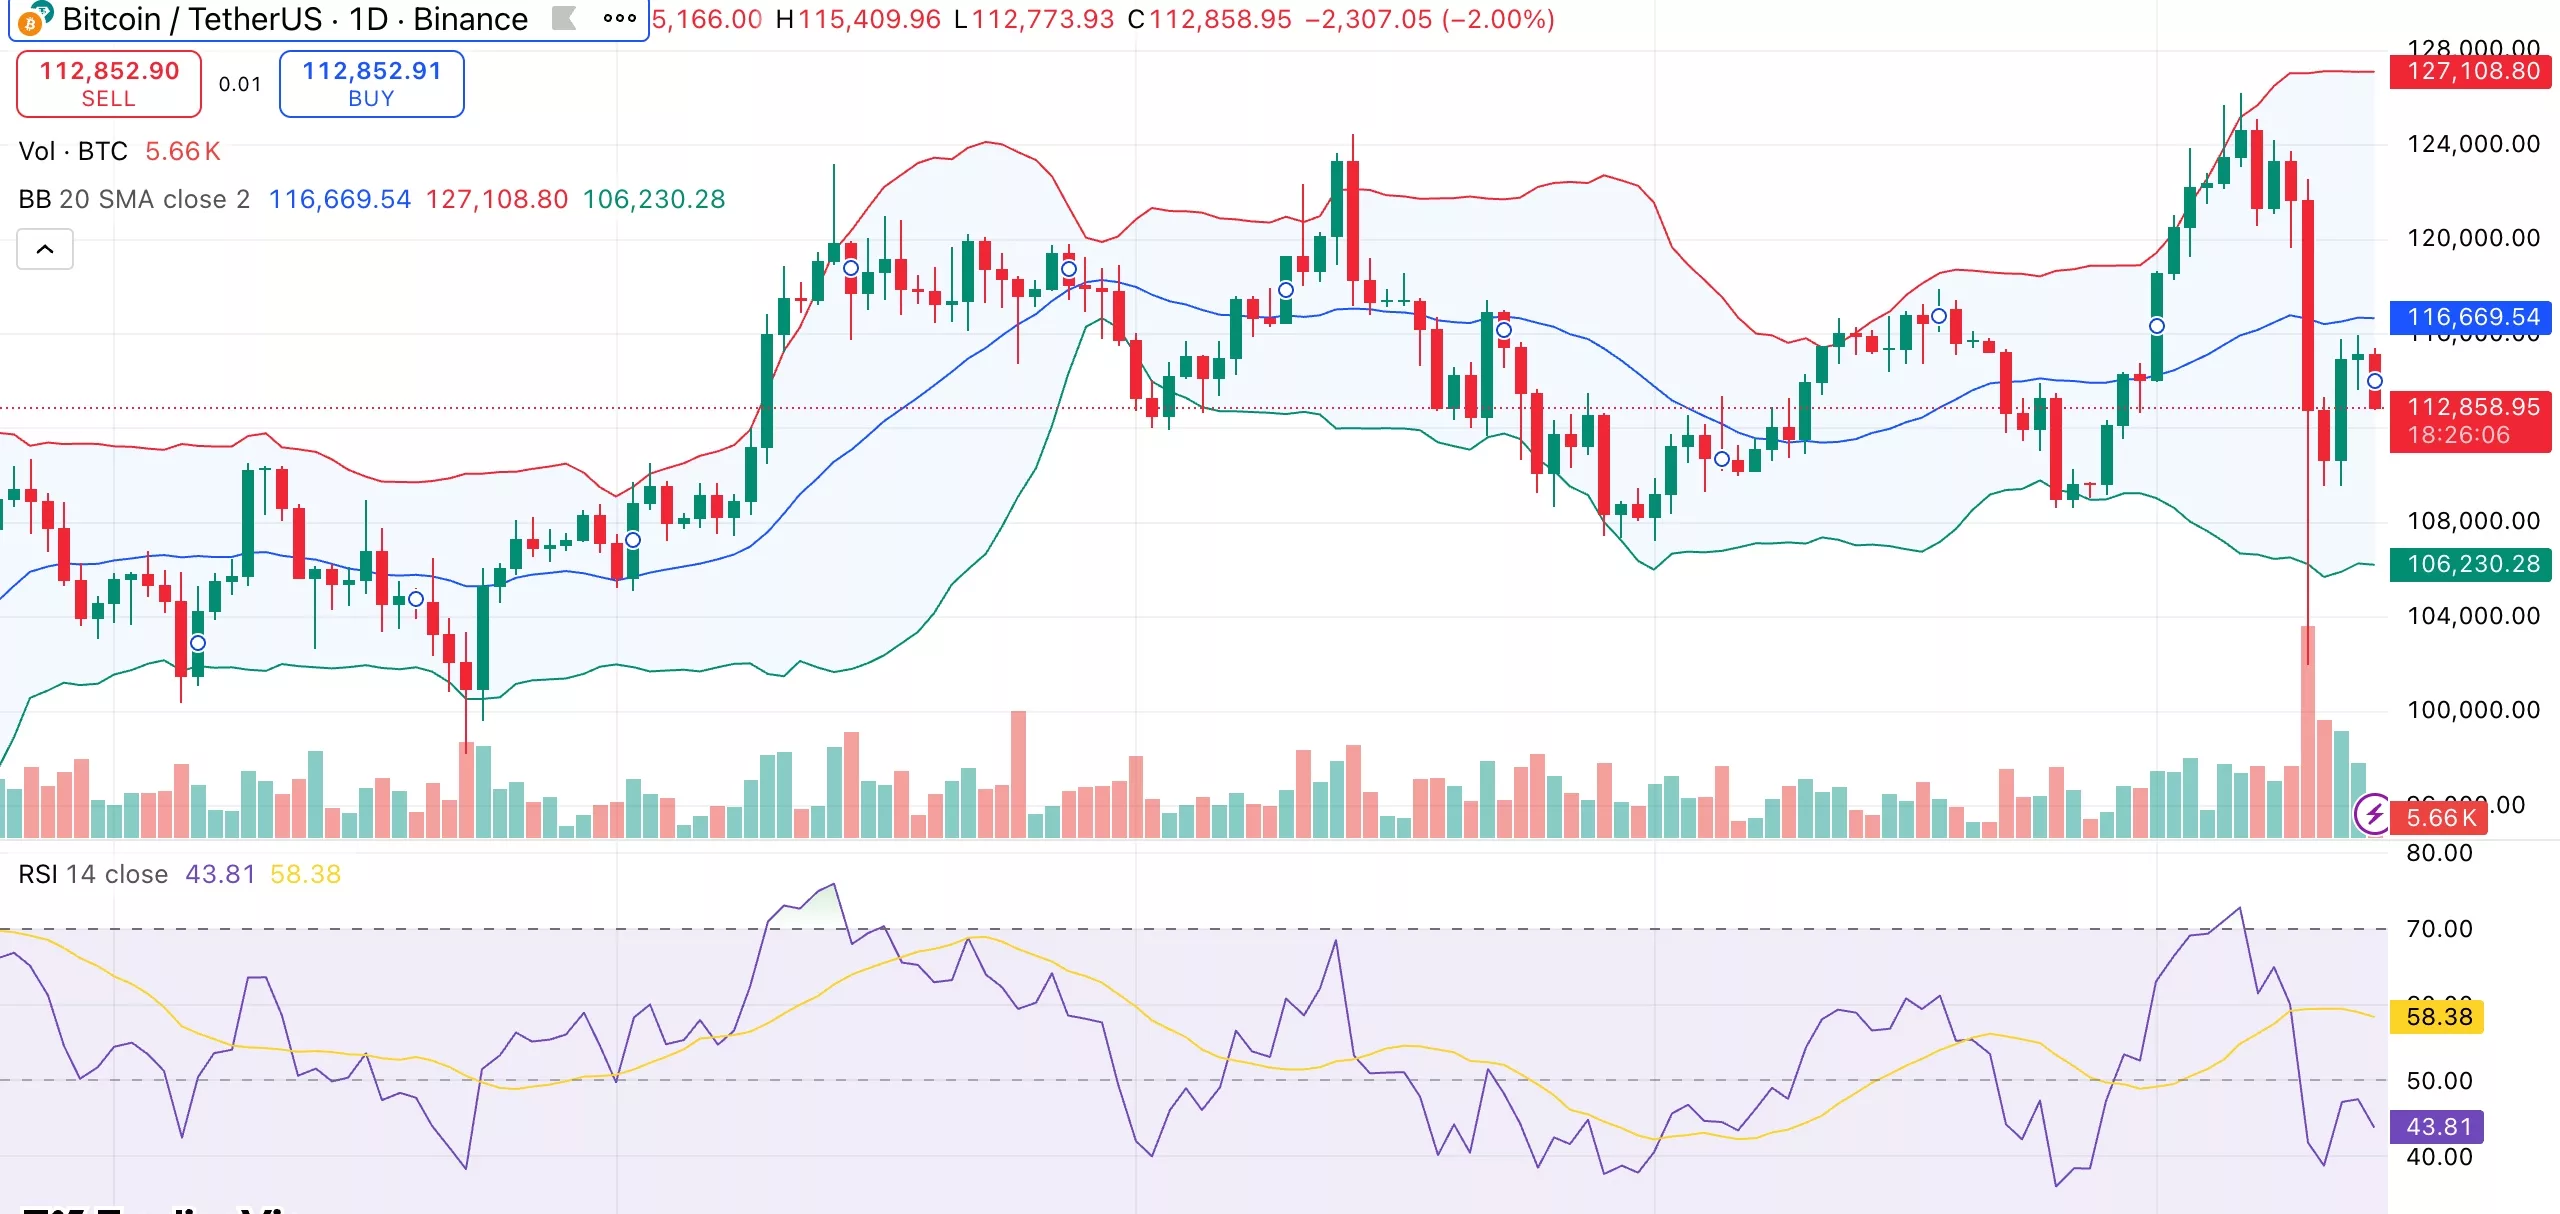
The 200-day averages, around $108,000, act as solid support. As long as Bitcoin holds this area, the long-term structure remains intact.
A break above $116,000 to $118,000 WOULD indicate fresh strength and could open the path back toward $125,000. If prices slip below $110,000, the next test could come near $105,000.
