Aster Price Primed for Short-Term Breakout as OKX Exchange Listing Looms

Aster rockets toward critical resistance levels ahead of major exchange debut
The Technical Setup
Chart patterns scream bullish as Aster consolidates near key psychological barriers. Trading volume spikes 47% in the last 24 hours—market makers positioning for the OKX catalyst. Resistance at $2.85 looks increasingly fragile as accumulation patterns emerge across multiple timeframes.
The OKX Effect
Exchange listings remain crypto's ultimate price catalyst. OKX's global reach injects instant liquidity and visibility—remember what happened to previous debutants? Retail FOMO meets institutional accumulation in a perfect storm of buying pressure.
Market Mechanics
Short positions getting squeezed while long-term holders refuse to sell at current levels. The classic pre-breakout compression pattern suggests explosive movement within 48 hours. Technical indicators across RSI, MACD, and volume profiles all align for upward momentum.
Because nothing says 'sound investment' like betting on digital tokens because they're getting listed on another casino—sorry, exchange. The breakout either validates the hype or exposes another pump-and-dump in this beautifully unregulated circus we call crypto.
ASTER OKX listing adds momentum
OKX confirmed that ASTER deposits opened at 2:00 a.m. UTC, and full spot trading will launch at 6:00 a.m. UTC. Initial controls include a $10,000 order cap to mitigate volatility.
📢 #NewListing
OKX will list $ASTER @Aster_DEX!
🟢 $ASTER/USDT Spot trading will begin at 6:00 AM on 17 Oct(UTC).
More: https://t.co/js5mAxgAk2 pic.twitter.com/Bn4hEM0rjN
This listing comes shortly after OKX added ASTER perpetual futures in late September. The timing aligns with the project’s rapid growth. It’s decentralized exchange recently hit $42.8 billion in daily perpetuals volume, outpacing some competitors in the same niche.
Aster launched on Sept. 17 and has since expanded to over 70 exchanges with more than 115 trading pairs, according to CoinGecko.
Though there is still a chance of short-term volatility, upcoming events like the Stage 3 airdrop and the Aster Chain LAYER 1 launch in Q4 could increase engagement even more.
Aster price technical analysis
On the 1-hour chart, Aster trades within a narrow range near $1.28, close to the lower Bollinger Band. Following several days of decline, the relative strength index, which is currently at 48, indicates balanced momentum.
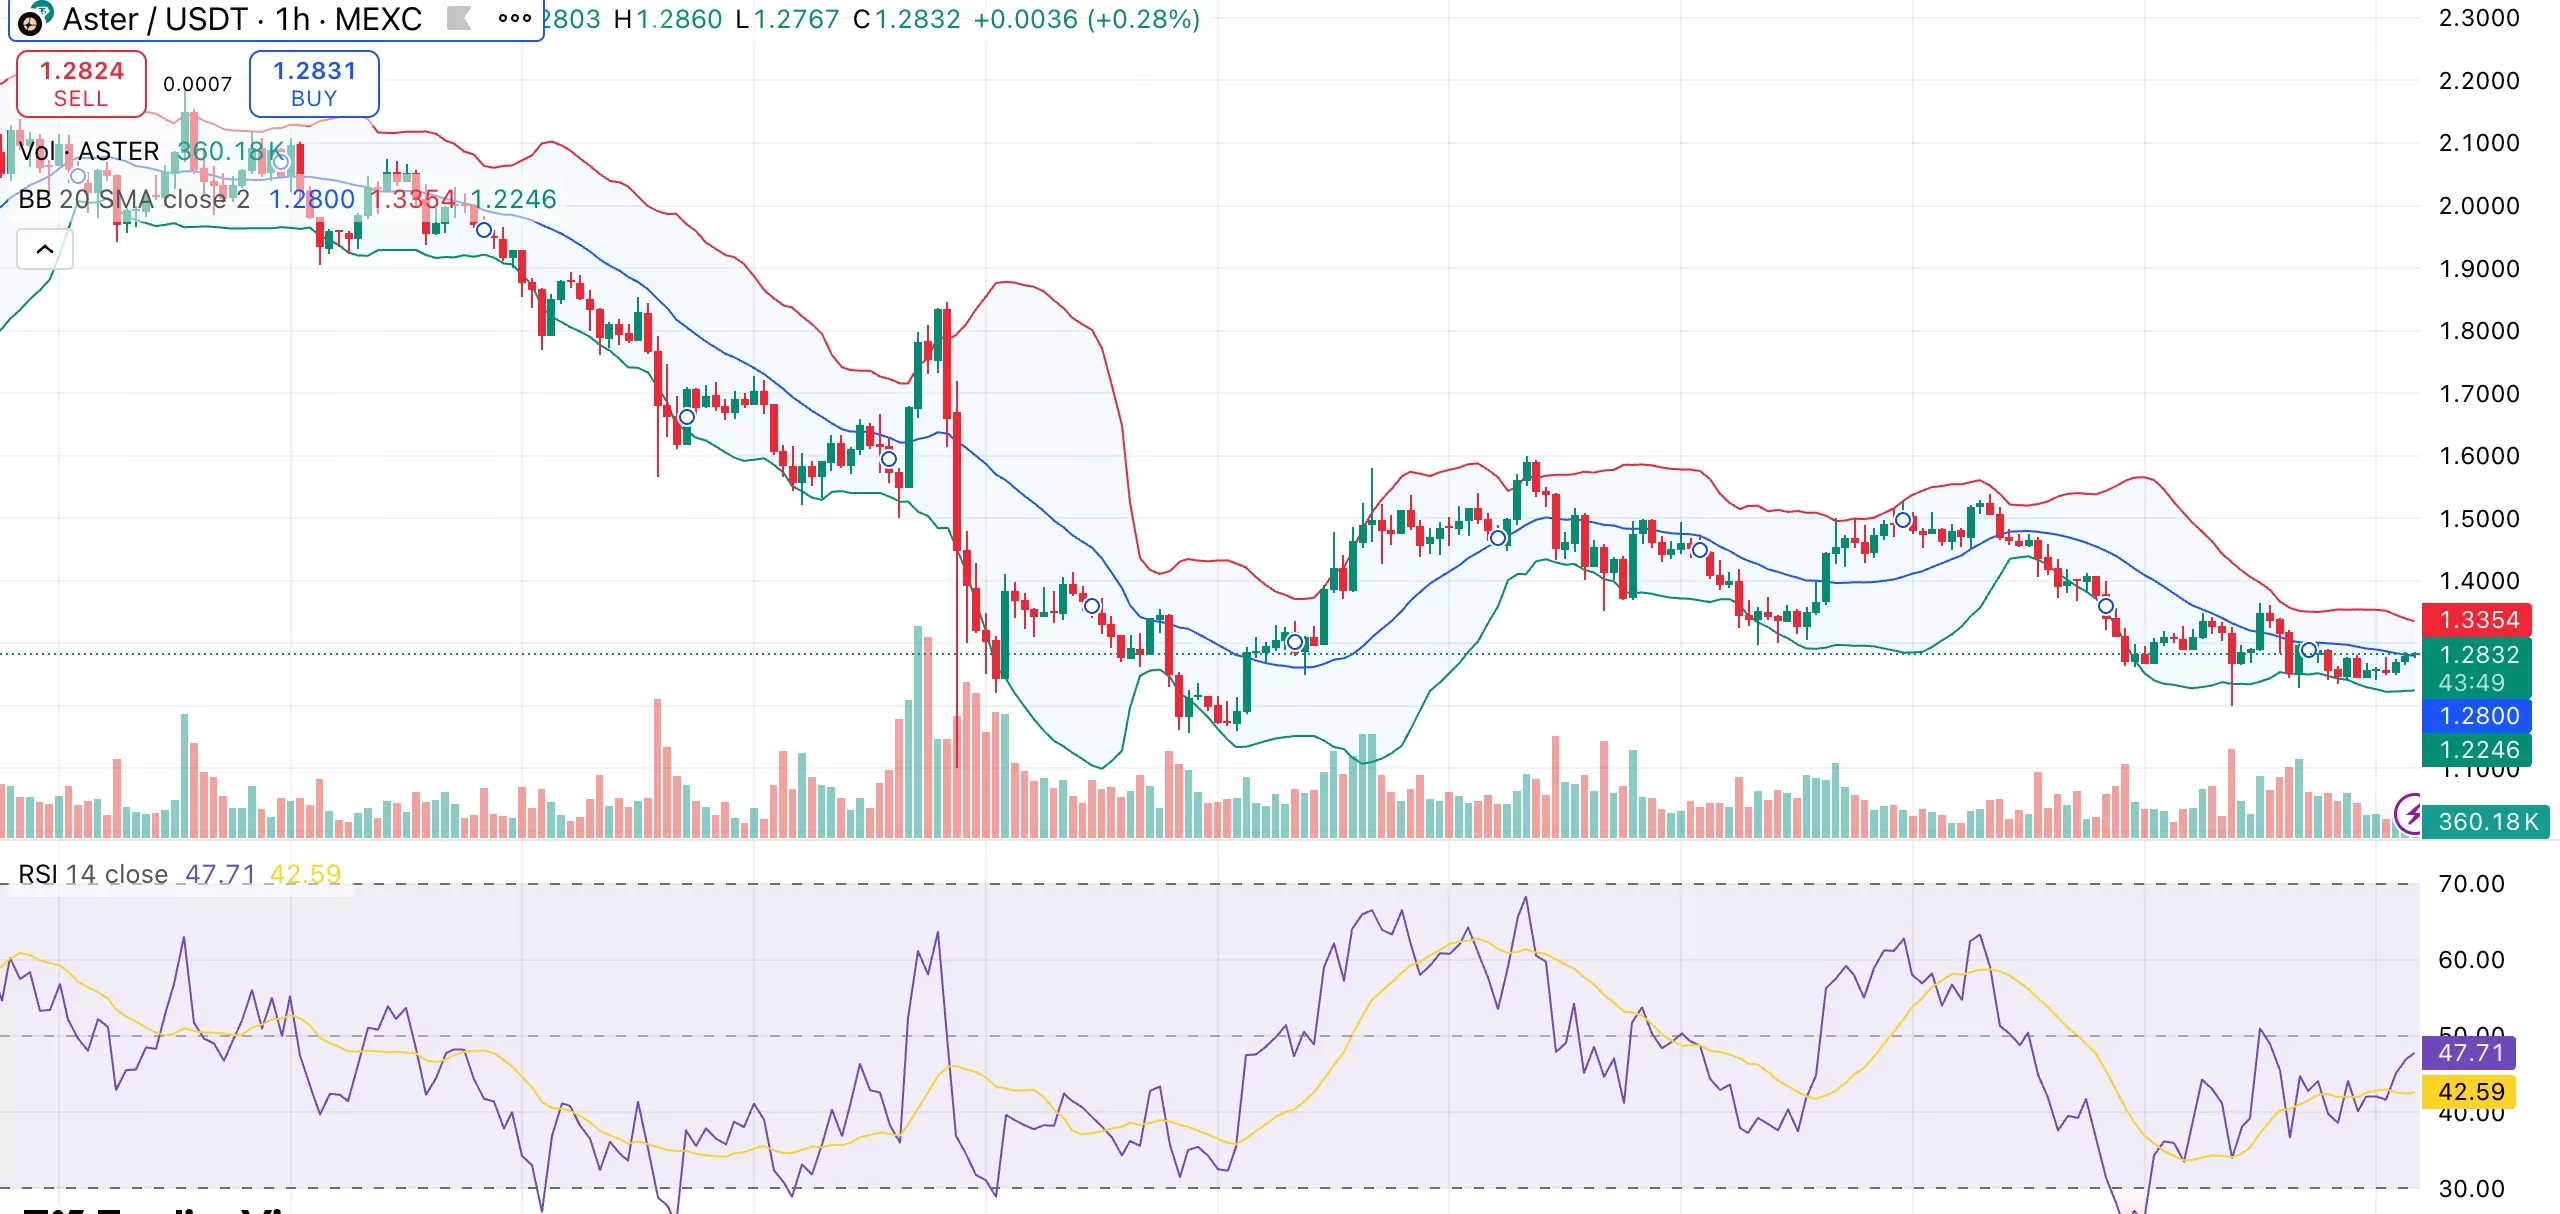
The overall trend remains cautious as the short-term moving averages (SMA and EMA 10–20) continue to show slight selling pressure. However, oversold conditions, a zone where reversals often start, are indicated by the commodity channel index and Williams %R.
Stronger resistance is located around $1.65, and a push toward $1.48 may occur if buyers recover the $1.34 level. On the down side, a drop toward $1.10–$1.15 might become possible if $1.22 is lost. With price compression suggesting an early-stage breakout, the setup currently leans neutral to slightly bullish.
