TRUMP falls 59% in a month – Will it crash to $8 next?

- An additional decline is underway as TRUMP breaches a consolidation phase.
- On-chain and technical indicators add to the tendency of a likely price drop.
Official Trump [TRUMP] recorded one of the steepest losses in the market, dropping 13.46% and bringing its price to the $11 region, at press time.
This follows an extremely poor performance from the asset over the past week and month, with declines of 32.07% and 59.41%, respectively.
Interestingly, a fractal pattern TRUMP has been trailing suggests the asset’s price could slide even lower, below the $10 region.
TRUMP’s fall to a single-digit figure—$8
At the time of writing, TRUMP has been trailing a fractal pattern, suggesting a likely further decline.
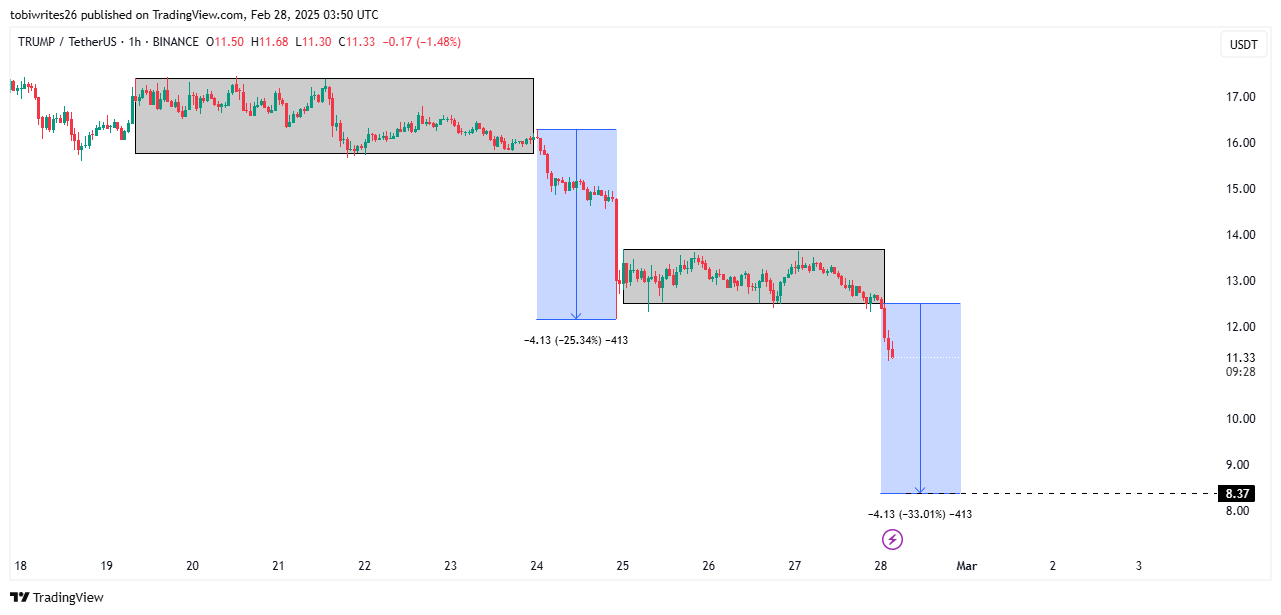
A closer look at the 1-hour chart shows that after consolidating for four days, TRUMP recorded a major drop. This first occurred between February 19 and 23, with the asset consolidating before a 25.34% drop to the $12 region.
Source: TradingView
A similar scenario is unfolding, with TRUMP exiting another four-day consolidation phase between the 23rd and 28th of February. It is now on track for a 33.13% decline, targeting $8.37—a level last seen shortly after launch.
To assess the likelihood of this drop, AMBCrypto examined the derivatives market and found that speculation remains bearish.
Speculation for a potential fall
Key metrics in the derivatives market hint at a potential price decline, with the Open Interest (OI)-Weighted Funding Rate and Taker Buy/Sell Ratio indicating high selling volume.
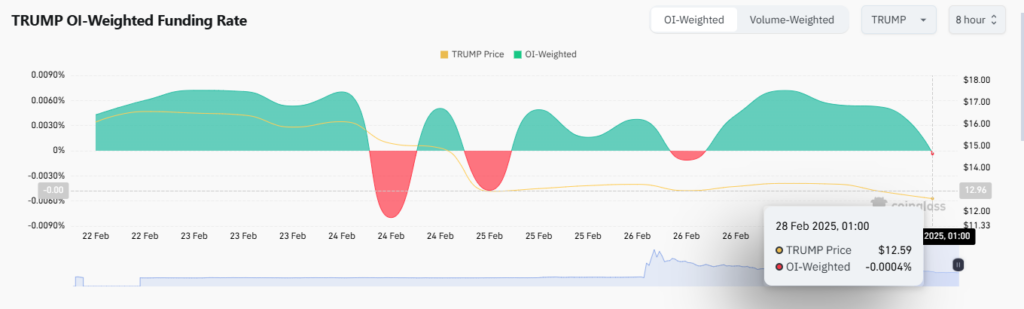
The OI-weighted sentiment, which was bullish for two consecutive days, has now turned negative, with a reading of -0.0004%, implying a growing bearish sentiment.
The OI-Weighted Funding Rate combines Funding Rate data with Open Interest to determine market trends, making it a reliable measure of trading activity.
Source: Coinglass
The Taker Buy/Sell Ratio confirmed the bearish sentiment, as there has been more selling volume than buying volume. This is determined based on whether the ratio is above 1 (buying) or below 1 (selling).
At the time of writing, this ratio had declined to 0.9231, indicating high selling pressure. If it drops below 0.9, speculation will become highly bearish, accelerating TRUMP’s fall to the $8 region.
Bears’ presence confirmed
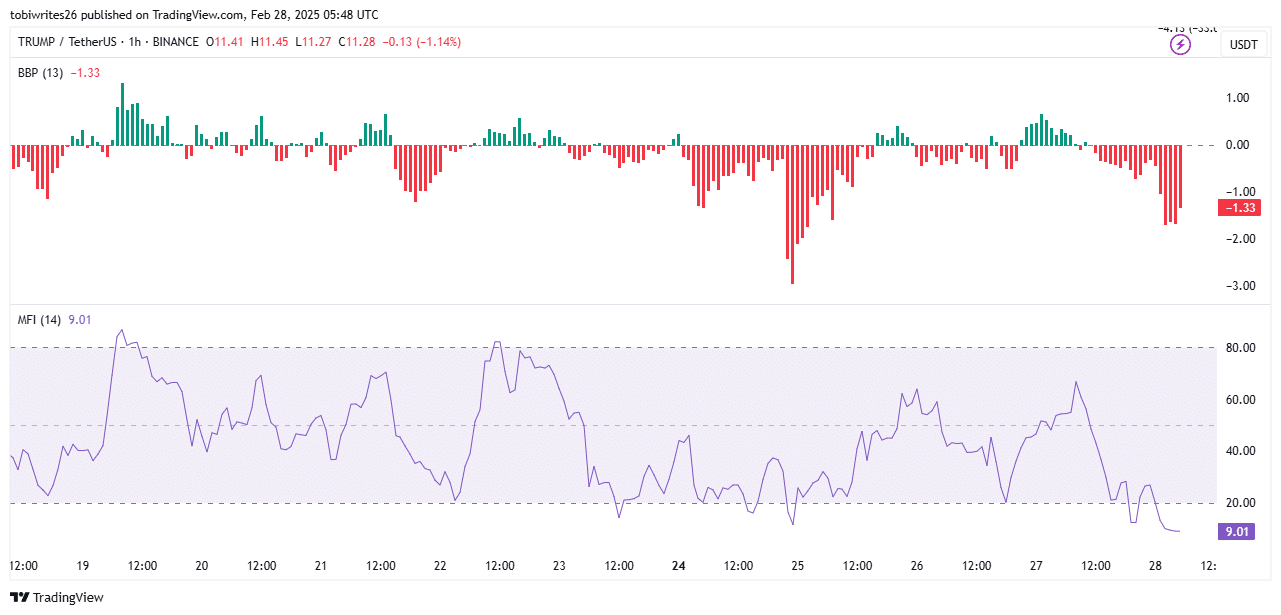
The Bull-Bear Power (BBP) indicator, which compares buyer and seller presence in the market, confirms the ongoing bearish sentiment.
BBP indicator’s momentum has shifted to the negative region, to -1.40, a level it has maintained since the 25th of February.
Source: TradingView
Meanwhile, the Money Flow Index (MFI) has entered the oversold region, suggesting sellers could soon exhaust their momentum, allowing for a brief price relief.
However, if other key indicators remain bearish, any relief will likely be short-lived, leading to further declines.
For now, investors remain focused on selling TRUMP, which could play a major role in the asset’s return to $8.
Take a Survey: Chance to Win $500 USDT

Log in to Reply
Log in to comment your thoughtsComments
Related Articles