Stellar [XLM] price prediction – ‘Bearish’ market structure, but traders can see gains IF…

- XLM bulls have been attempting to flip the $0.3-level to support once again
- RSI and OBV on the 4-hour chart gave early signs of bullishness
While Stellar [XLM] continued to maintain a bearish trajectory, the trading volume has been low in recent weeks. This suggested that the bearishness was only a product of the wider market uncertainty and Bitcoin [BTC] losses.
In fact, the token seemed to be at a critical juncture on the lower timeframe price charts. The bulls were challenging the $0.3 resistance level too. Hence, the question – Can they succeed in creating a breakout?
Stellar forms a short-term range and faces resistance up to $0.31
Source: XLM/USDT on TradingView
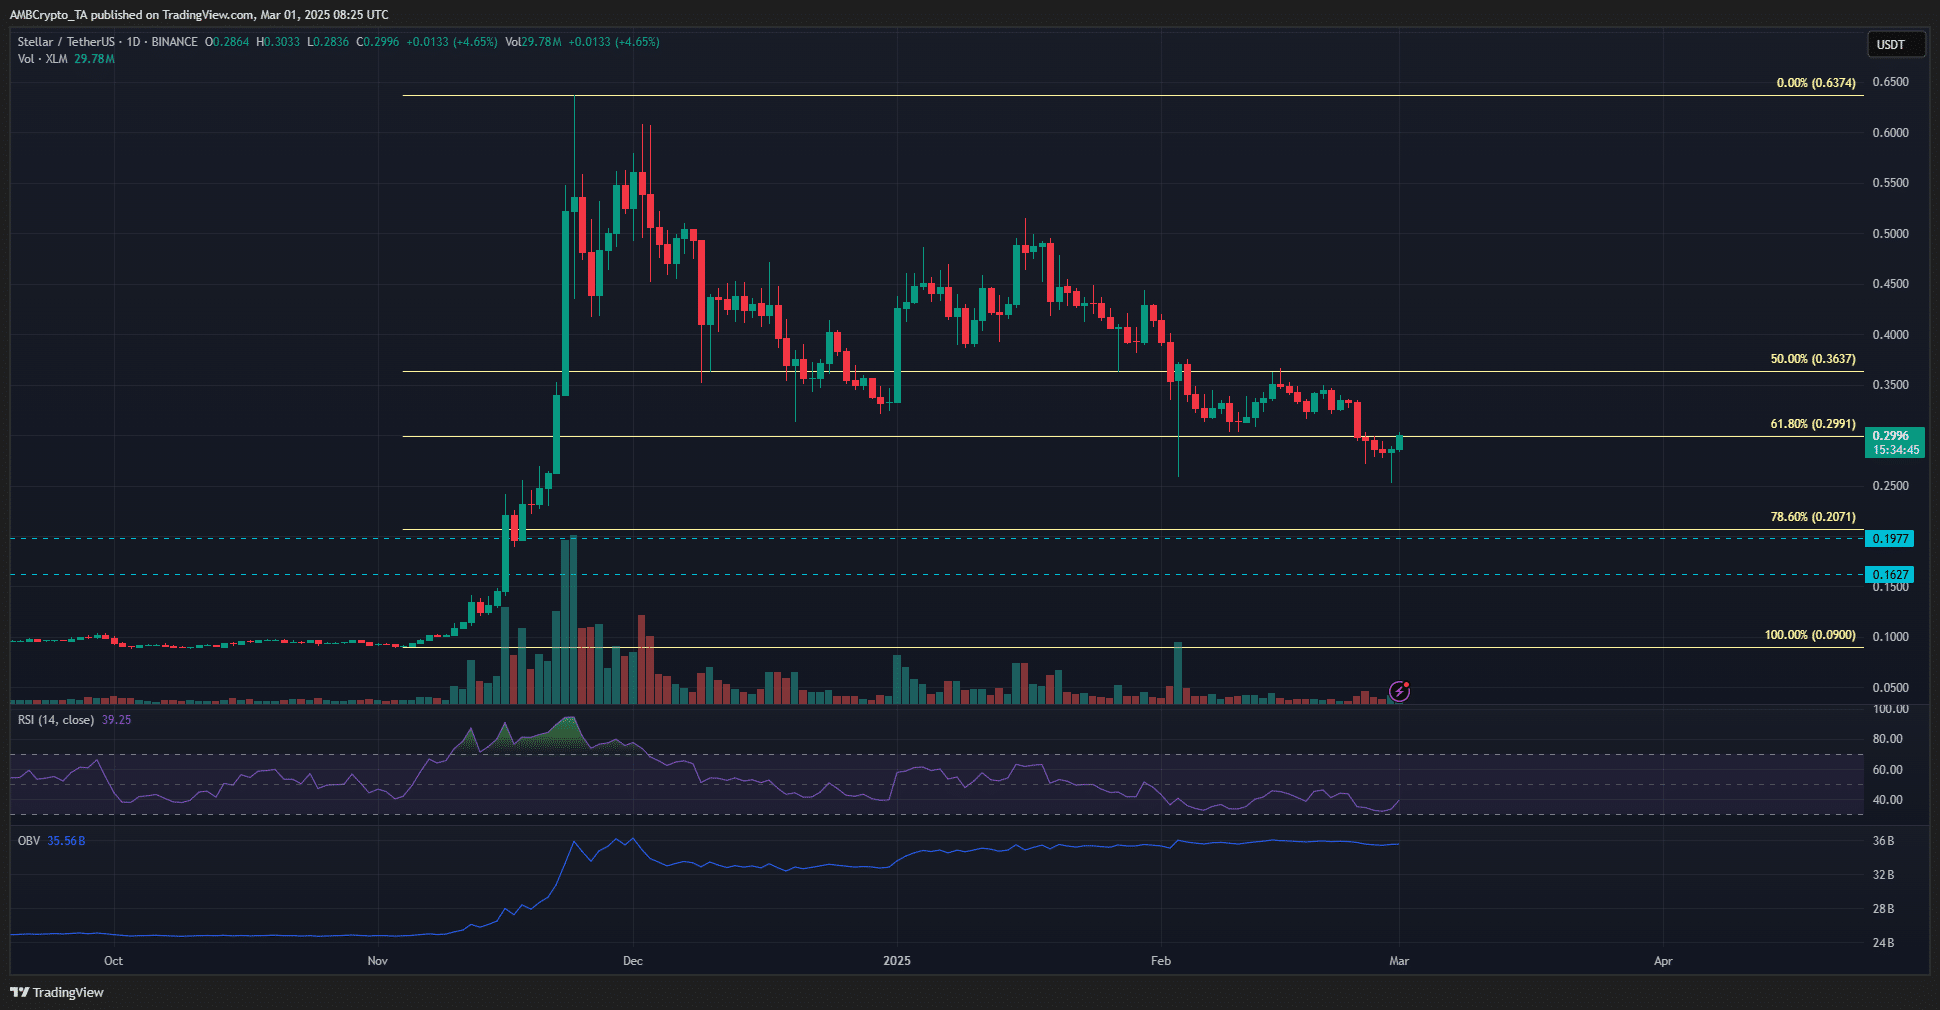
The 61.8% Fibonacci retracement level has been flipped from support to resistance. At press time, the price witnessed a 19% bounce in a day and was testing the $0.299 region as resistance. It may be possible that the bulls’ efforts would be rebuffed once again.
The 1-day market structure had been bearish throughout February. Until this changes, swing traders should not be betting on a bullish reversal. Instead, price bounces such as the most recent one could offer an opportunity to sell.
At press time, the RSI on the daily chart remained below 40 to reflect sizeable bearish momentum, but the OBV was not on a downtrend. This underlined the lack of high selling volume, despite the losses in February. This hinted at the potential for a quick recovery, if Bitcoin can turn things around.
Source: XLM/USDT on TradingView
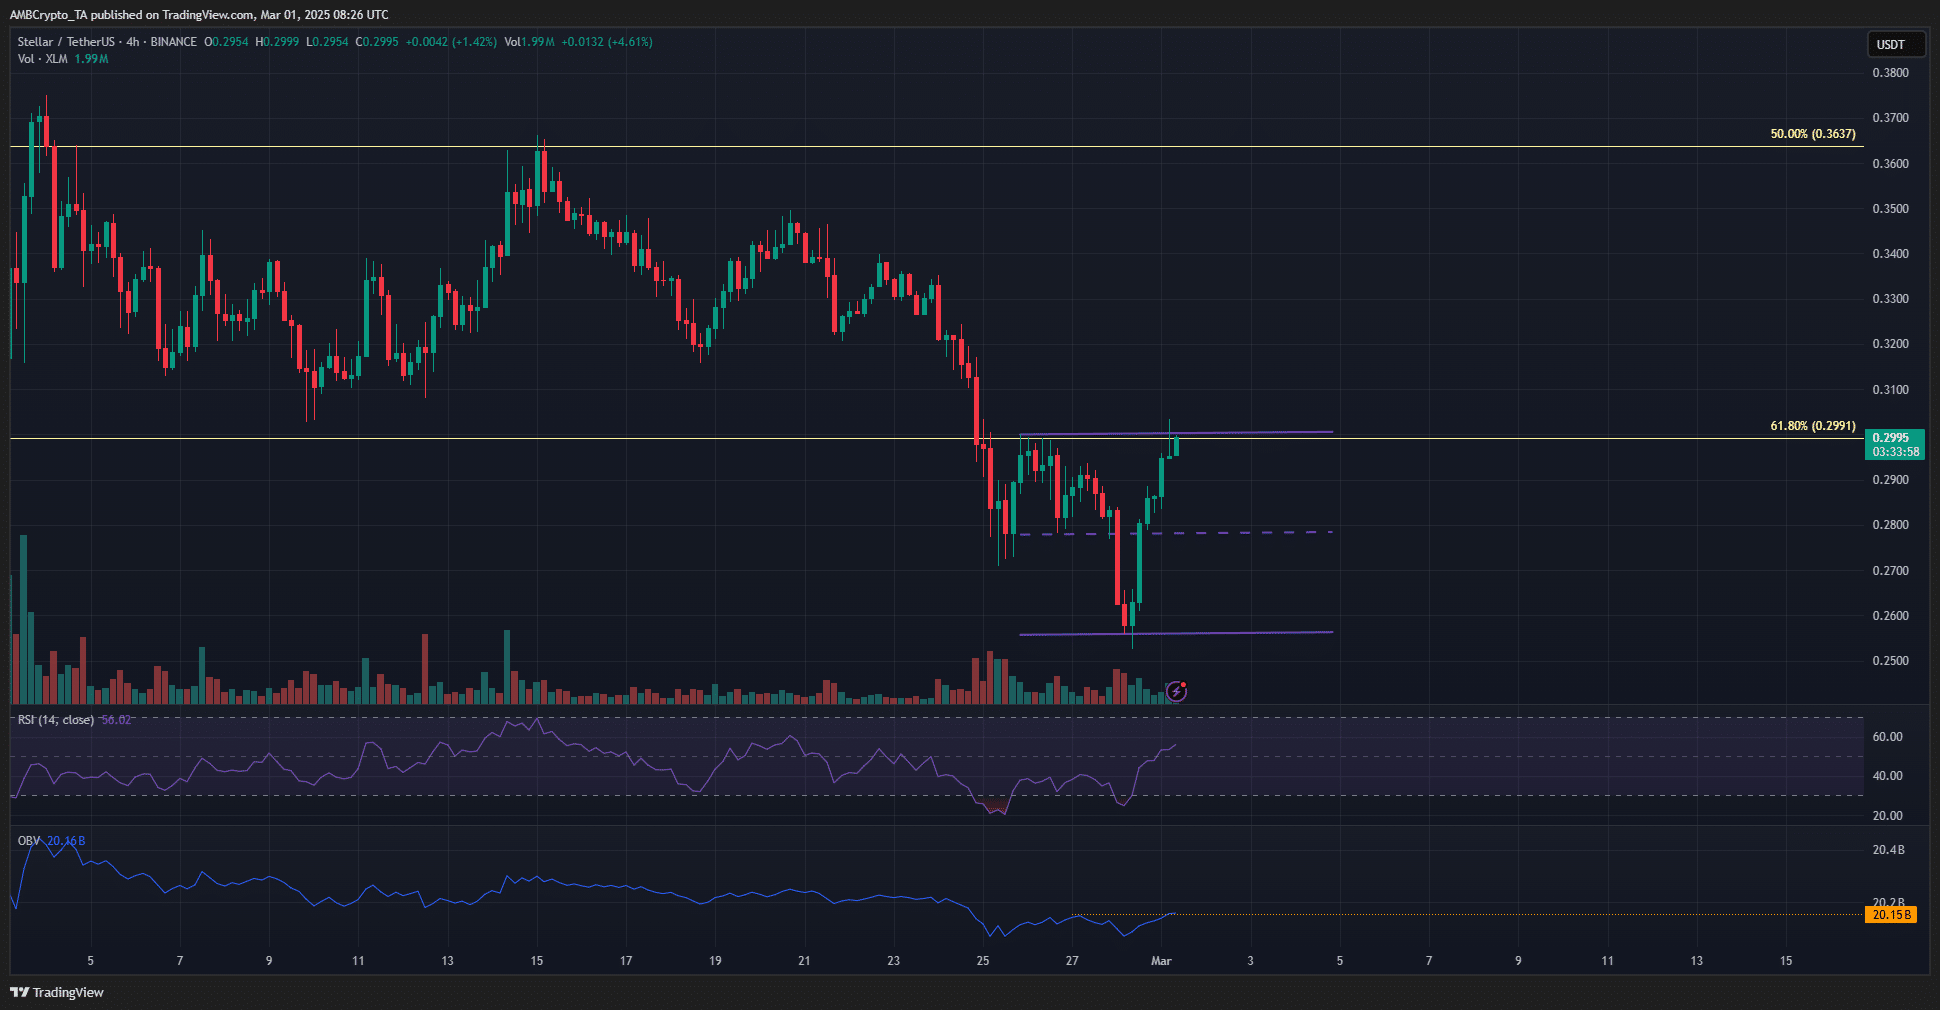
The 4-hour chart revealed a range formation between $0.256 and $0.3. Just above, the fair value gap from $0.303-$0.31 was also likely to oppose the bulls’ progress. Hence, even though the RSI was above neutral 50 and the OBV breached the local high, traders can expect a bearish move.
Invalidation of this idea would be a retest of $0.3 as support, followed by a move beyond $0.31. Meanwhile, rejection from $0.3-$0.31 can be used to go short on XLM, targeting the $0.273 and $0.256 levels.
Source: Coinglass
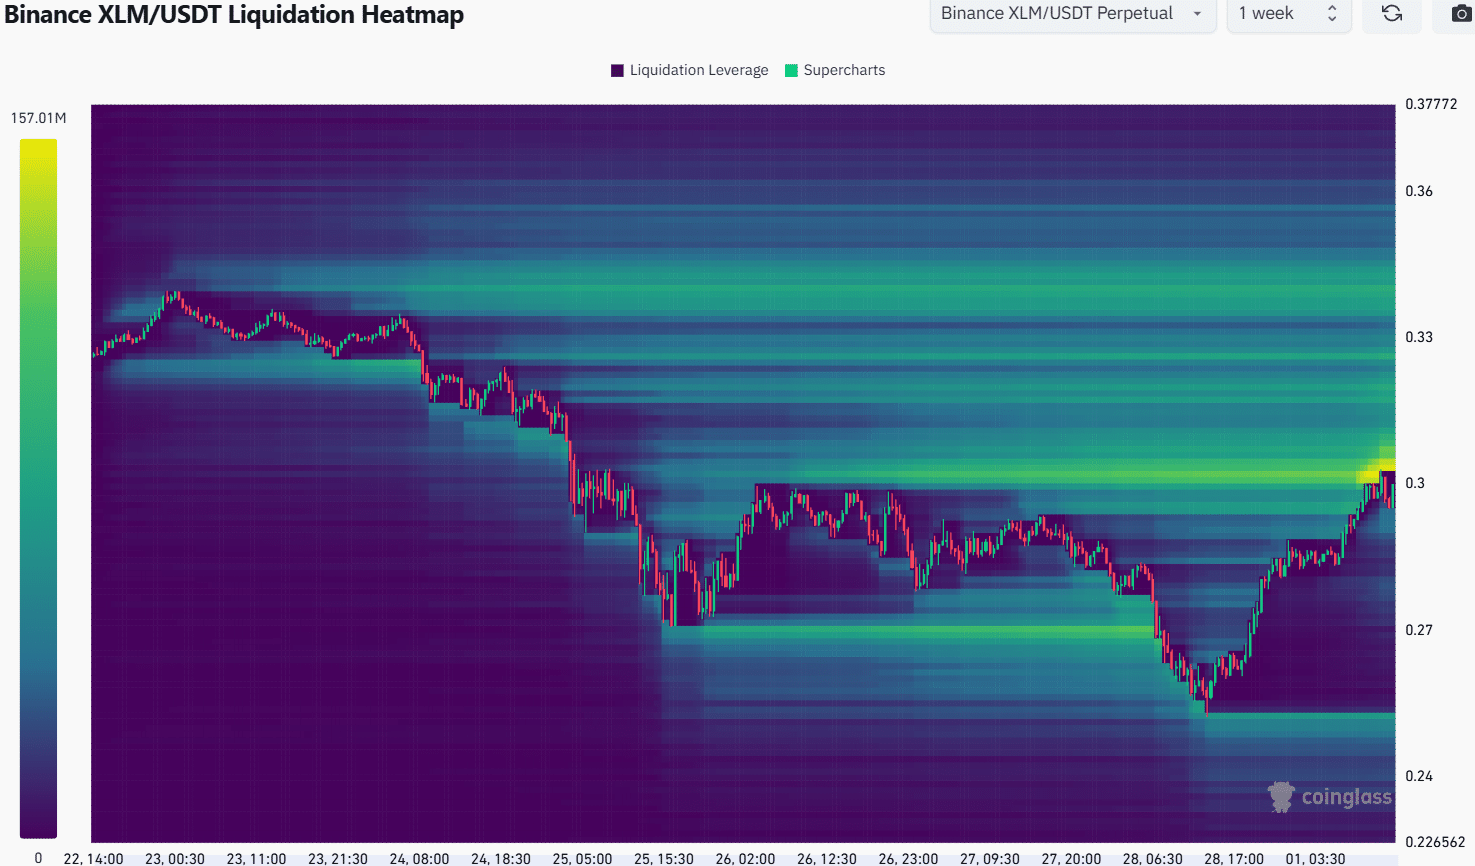
The past week’s liquidation heatmap highlighted a strong magnetic zone just overhead. The $0.303-$0.31 zone has a cluster of liquidation levels that could be tested before a bearish reversal. However, traders must remain cautious.
The 1-month liquidation heatmap revealed that the $0.35 and $0.37-levels were also sizeable liquidation zones that could attract Stellar’s price to themselves. Therefore, if the $0.3-level is flipped to support, traders would have to flip their bearish bias and anticipate further gains.
Disclaimer: The information presented does not constitute financial, investment, trading, or other types of advice and is solely the writer’s opinion
Take a Survey: Chance to Win $500 USDT

Log in to Reply
Log in to comment your thoughtsComments
Related Articles