Ethereum Poised for Explosive Breakout Against Bitcoin – Top Analyst Reveals Critical Sell Window

Ethereum's long-awaited moment against Bitcoin might finally be here. The ETH/BTC chart is coiling tighter than a spring, signaling a potential breakout that could redefine crypto market leadership.
The Setup: A Classic Technical Squeeze
For months, the ratio has traded in a narrowing range—a textbook consolidation pattern. Each failed attempt by Bitcoin to decisively pull away has only strengthened Ethereum's relative support. Now, key moving averages are converging, volume profiles are shifting, and the Bollinger Bands are at their tightest in over a year. It's the quiet before the storm.
The Catalyst: More Than Just Charts
Technical alignment is one thing, but fundamentals are providing the fuel. Ethereum's core development pipeline—prototype-stage upgrades, scaling solutions gaining real traction, and a staking ecosystem that's locking away supply—creates a structural tailwind Bitcoin simply can't match. While Bitcoin debates store-of-value narratives, Ethereum is busy building the financial stack. (A cynical observer might note this is the crypto version of 'talking vs. doing'—and Wall Street loves a good story until the numbers arrive.)
The Trade: Timing the Exit
So when to sell? The analyst's model points to a specific profit-taking zone. It's not about calling the absolute top—that's a game for gamblers—but identifying the point where the risk/reward flips. The target is derived from measured move projections of the current consolidation range and historical resistance clusters. The plan: ride the initial breakout momentum, then scale out as the ratio approaches these predefined technical ceilings. Greed turns winners into bag holders faster than you can say 'corrective pullback.'
Markets move on narratives, but they sustain on structure. Ethereum's looks ready to hold.
Ethereum Approaches Key Sell Zone Against Bitcoin
Crypto market technician John Carter has illustrated a bullish setup for the ETH/BTC pair in one of his latest chart analyses on X. According to Carter, Ethereum is reaching a critical decision point against Bitcoin, with price hovering near an important technical level within a Broadening Wedge pattern. The setup points to a potential breakout, highlighting a clearly defined resistance zone where selling pressure is expected to emerge.
Notably, Carter has stated that Ethereum is currently approaching the upper boundary of the long-term Broadening Wedge on the weekly chart. This structure has guided Ethereum’s performance relative to BTC for several years, with prices expanding between widening trendlines.
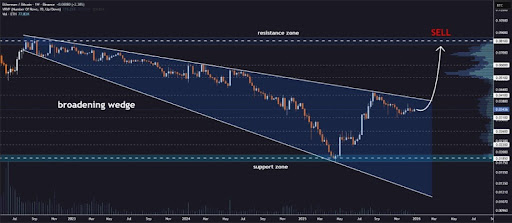
Recently, ETH/BTC bounced from the lower support zone of the Broadening Wedge, confirming that buyers are defending that level. The rebound from support was sharp and well defined, and after touching the lower boundary of the wedge, the pair launched a strong recovery leg. This upward MOVE pushed the price back into the upper half of the wedge, setting ETH/BTC on a direct path toward resistance.
According to Carter, ETH/BTC is now completing its final phase of consolidation within the wedge. As a result, breakout signals are emerging as price tightens NEAR resistance, and the trading pair holds higher lows. If ETH/BTC confirms a breakout above the wedge’s upper boundary, Carter predicts that it will climb to an initial target of $0.041, aligning with a previous consolidation area.
Beyond that, price could advance upward $0.051 and $0.060. The final upside target has been set at $0.081, which overlaps with the broader resistance zone on the chart. The analyst marks this resistance as a sell zone, showing when traders can begin taking profit.
Analyst Outlines Critical Support Levels For ETH/BTC
In his analysis, Carter also identified several support zones that could act as key defense levels if Ethereum faces a pullback against Bitcoin. The first major support zone lies near the upper boundary of the Broadening Wedge pattern, around $0.031. Below that, the analyst has pinpointed another support level at $0.026.
If the price falls below $0.026, the next notable support is around $0.022, representing a roughly 35% decline from current levels above $0.034. In the event of an even deeper correction, Carter forecasts that ETH/BTC could drop to $0.0185, a level marked on the chart as the Broadening Wedge’s “support zone.” Any move below this support WOULD likely push ETH/BTC toward the lower boundary of the wedge, which extends down to $0.010.
