Bitcoin Hits $94,000 Wall: Heavy Sell Pressure Threatens Rally Momentum

Bitcoin's charge toward six figures just slammed into a brick wall. The $94,000 resistance level is proving tougher than expected, triggering a wave of profit-taking that's testing the rally's core strength.
The $94K Ceiling: A Classic Battle
Every major rally faces a moment of truth—a price zone where early believers cash out and new money hesitates. For Bitcoin, that zone is now. The surge toward $94,000 wasn't just a number; it was a psychological trigger, unleashing sell orders that had been waiting in the wings for months. This isn't a malfunction; it's the market's natural cooling system kicking in.
Momentum Check: Healthy Pause or Trend Reversal?
So, is the party over? Not necessarily. A pullback here doesn't kill the bull market—it sustains it. Unchecked parabolic moves are the real danger, often ending in tears and another round of 'I told you so' from traditional finance pundits (who still think a ledger should be kept in a leather-bound book). The key metric isn't the sell pressure itself, but how quickly buyers absorb it. If support holds firm on higher timeframes, this is just a pit stop.
The Road Ahead: Volatility as a Feature
Expect chop. The path to new all-time highs is rarely a straight line. This sell pressure creates the volatility that sophisticated traders crave and that long-term holders simply ignore. The underlying narrative—digital scarcity, institutional adoption, monetary debasement elsewhere—hasn't changed. Sometimes the market needs to catch its breath, even if it gives everyone else heart palpitations.
Bitcoin isn't breaking; it's bending. And in finance, the assets that bend without breaking are the ones that last. The next few days will reveal whether this is a stumble or the start of a new dance floor—just don't expect Wall Street to understand the music.

After printing consecutive bullish candles, the Bitcoin bulls are facing some resistance, which is causing the price rise to stall. The token has been attempting to break the $94,000 barrier consistently since December but has thus far been unsuccessful. With this, it could appear that the momentum could be cooling off, but the BTC price remains above the key support zone. Therefore, with sellers defending overhead levels and buyers stepping in only on dips, the market is entering a critical decision phase.
Order Flow Shows Aggressive Sell Walls Above Price
Currently, the BTC price is trading around $92,000, after facing repeated rejection NEAR this zone. While buyers continue to defend the downside, the latest order book and heatmap data suggest that sellers remain firmly in control at higher levels.
The order-flow heatmap highlights dense sell liquidity clusters between $94,500 and $96,000 on major exchanges, including Binance, Bitfinex, and Kraken. These sell walls have repeatedly absorbed buy pressure, preventing Bitcoin from sustaining a breakout.
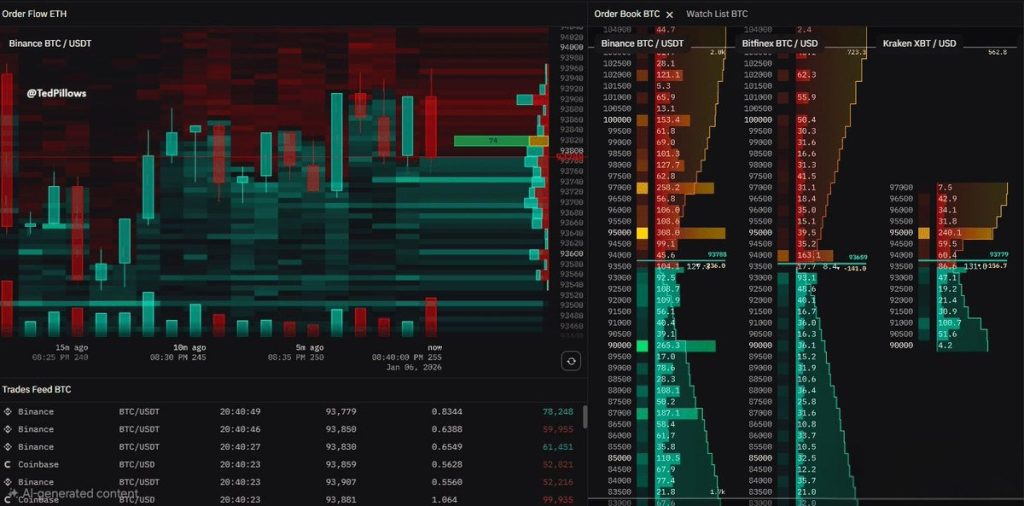
Large resting sell orders are visible just above $94,000, while cumulative asks increase sharply closer to $95,000. This explains why upward moves have stalled quickly despite multiple attempts. The trades feed shows consistent market buying near $93,500–$93,800, indicating that dip buyers are still active. However, this demand appears reactive rather than aggressive, stepping in only when the price pulls back instead of chasing higher levels. This behavior keeps BTC locked in a tight range, with neither side willing to fully commit.
The current liquidity distribution suggests a compression phase rather than a clean breakout setup. While downside liquidity below $92,000–$91,000 looks thinner compared to overhead resistance, buyers have so far managed to prevent a sharp breakdown.
From a market-structure perspective:
- Above $94K: Heavy sell-side dominance
- Below $92K: Buyers step in, but cautiously
- Between $92K and $92K–$94K: Choppy, low-conviction trading
What This Means for Bitcoin Price Action
Order-flow data indicates that bitcoin needs clear absorption of sell walls near $94,500–$95,000 to unlock further upside. Without that, price is likely to remain range-bound or face renewed rejection from overhead supply.
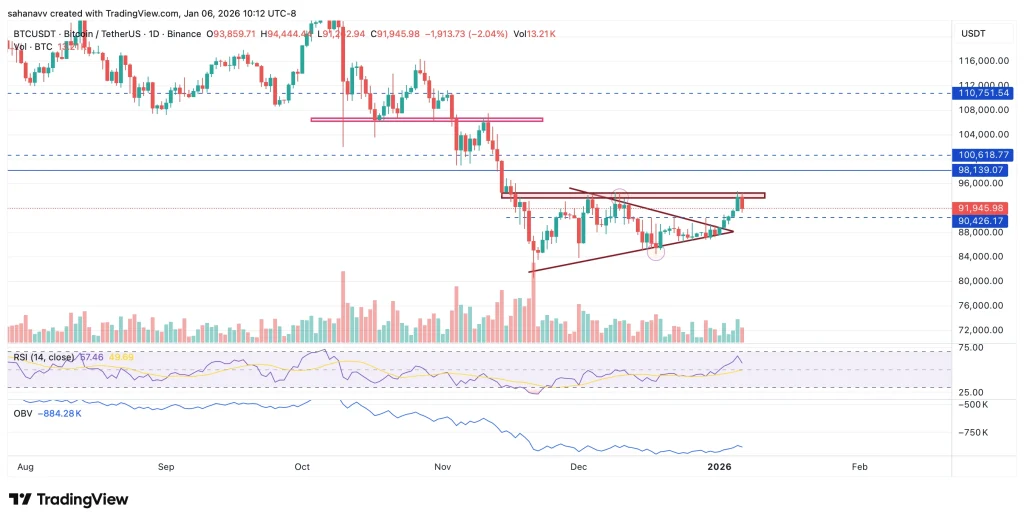
As seen in the above chart, after breaking the decisive symmetric triangle, the BTC price faced resistance between $93,500 and $94,500. The RSI and the OBV also displayed a sharp bearish divergence along with the price. This suggests the bullish momentum has stalled, and as the CMF remains under 0, no major liquidity is supporting the upswing. Therefore, the Bitcoin price is believed to remain consolidated below the resistance zone but defend the support zone at the 50-day MA around $89,200.
The Bottom Line
From a trading perspective, Bitcoin remains capped below the $94,500–$95,000 supply zone, where repeated sell absorption is visible on the order-flow heatmap. A sustained break and acceptance above this region could open the door toward $98,000, followed by the psychological $100,600 level. On the downside, failure to hold $92,000 WOULD expose BTC to a deeper pullback toward $90,400 and potentially $88,800, where buyers have previously stepped in. Until one of these levels gives way with volume, Bitcoin is likely to remain in a range-bound, high-volatility environment.
