Bitcoin Price Prediction: Physics Model Reveals $93K Miner Floor – Is $100K the Next Stop?

Forget the tea leaves. A physics-based model just flashed a signal that's got the crypto world buzzing.
The Miner's Unbreakable Floor
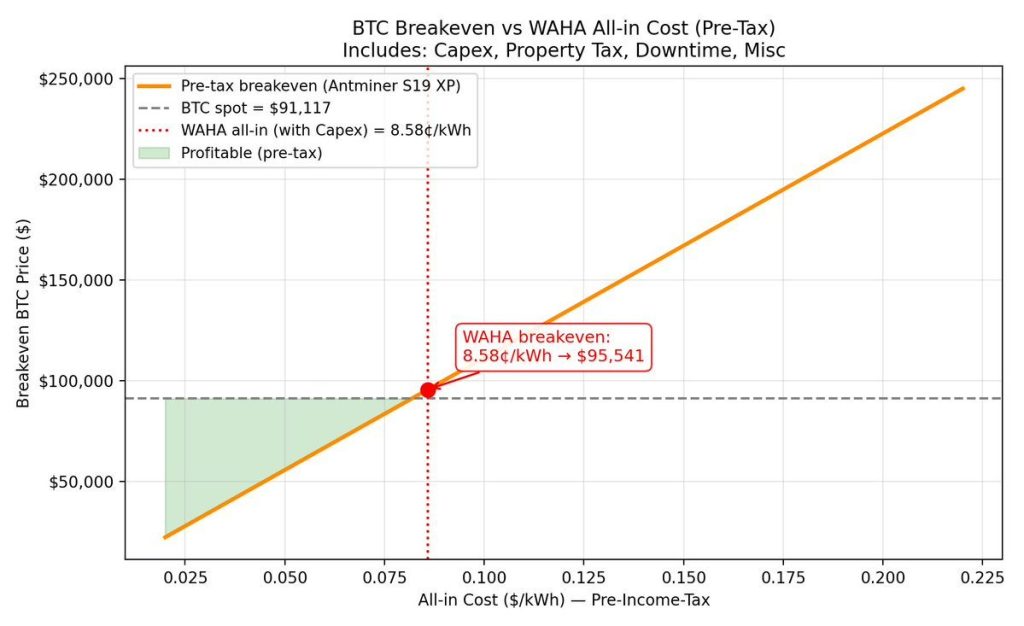
Deep in the code and the calculus, analysts have pinpointed a support level that looks more like bedrock than a typical trendline. The model, which treats market forces like physical laws, suggests miners have effectively built a floor under Bitcoin at the $93,000 mark. It's the cost of doing business, etched in energy and silicon.
The $100K Psychological Barrier
With that foundation reportedly locked in, the gaze shifts upward. The century mark—$100,000—looms not just as a number, but as a massive psychological and technical resistance zone. Every chartist and their cousin has that line circled. A clean breakout here wouldn't just be a milestone; it would be a statement.
The Setup and the Skeptic
The stage seems set: solid support below, a historic target above. Momentum builds on the promise of scarcity and adoption narratives that never seem to go out of style. Of course, if you believe the typical finance pundit, this is all just a speculative fever dream—right up until their firm quietly launches a crypto ETF. The model provides the map, but the market, with all its human greed and fear, still has to drive the car. Buckle up.
Miners Surviving on Cash Flow, Bleeding Long-Term
According to analysis shared by renewable energy Engineer David, bitcoin miners are surviving on cash flow but losing money on a full-cycle basis.
Update, The Physics of Bitcoin's Silence
Everyone's watching price. almost no one's watching the machine underneath it.
Here's what's actually happening:
bitcoin isn't stuck. it's being compressed.
Two forces fight for price: → real demand (etf flows, spot bids) → mechanical… pic.twitter.com/m5MRrOtIjI
![]()
Inefficient rigs (cost >$90,000) are underwater now. However, these miners don’t exit; they bleed until the network recovers.
“Bitcoin can trade below its energy floor briefly. It cannot stay there,” David explained.
David added that everyone watches the Bitcoin price, but almost no one watches the machine underneath.
“Bitcoin isn’t stuck, it’s being compressed,” he said
“Right now, demand is winning the war but losing every battle.” $1.2 billion flowed into spot ETFs this week, and the price moved sideways. “That’s not failure. That’s absorption.”
Currently, the $90,000 level represents the hedge. Bitcoin miners are long gamma there, selling when the price rises, buying when it falls.
“They’re not betting against Bitcoin. They’re hedging their book.”
Every buy meets a hedge sell, every dip gets bought back, and this makes the range tighten and WOULD eventually crush volatility.
This is bullish because compression doesn’t destroy demand; it stores it.
Coins are currently being transferred from weak hands to strong hands at stable prices.
According to David, as volatility gets crushed, price compresses into the tight $93,000-$96,000 range. The major resistance wall sits at $100,000.
When it fades and demand returns, price doesn’t grind higher; it resets higher.
“This is the most dangerous moment to be bearish,” the Stanford engineer concluded.
The market is pinned by dealers, and the math points to bigger upside once the tight range breaks.
Price doesn’t break free by force; it moves when the hedge weakens.
At the start of the year, Bitcoin’s price sits around $91,300 with 100% hedge strength.
By late January, the hedge is expected to fall toward approximately 43%.
Bitcoin Price Prediction: Daily Chart Shows Base Formation Above $80K
The 1-day Bitcoin chart shows price stabilizing after a sharp correction, with structure depending on well-defined technical levels.
Bitcoin trades below the $100,000 psychological threshold, acting as a congestion zone, while the $93,000 miner energy floor has flipped from support into near-term resistance.
Declining EMAs (20, 50, 100-day averages) continue capping upside, reinforcing the corrective trend that began after the failed push above $120,000.

However, downside momentum has slowed. Price formed a base above recent lows NEAR mid-$80,000, and RSI recovered above 50, signaling a shift from bearish toward neutral-to-mildly bullish conditions.
This suggests selling pressure is easing.
If Bitcoin reclaims and holds above $93,000, the next test sits at $100,000, where a clean break would unlock pathways toward $109,000.
Bitcoin Hyper Presale Is Positioned for $100K Rally
Prediction market traders place over 80% odds on Bitcoin hitting $100,000 in 2026, which could benefit BTC-beta projects like Bitcoin Hyper.
Bitcoin Hyper ($HYPER) develops the first functional Bitcoin LAYER 2 using Solana-based technology for speed and scalability while preserving Bitcoin security.
The project has raised over $30 million to enable Bitcoin-native dApps, providing BTC holders opportunities to deploy assets productively using on-chain tools built for the Bitcoin ecosystem.
To acquire $HYPER before the next price increase, visit the official Bitcoin Hyper website and connect your wallet (like Best Wallet).
You can swap USDT or SOL for the token at the current presale price of, or use a bank card for direct purchase.
Visit the Official Bitcoin Hyper Website Here