Bitcoin Plunges Below $110K as Spot BTC ETFs Bleed $536M in Massive Outflows

Bitcoin's bull run hits a brutal wall as institutional investors flee en masse.
The Great ETF Exodus
Spot Bitcoin ETFs just witnessed a staggering $536 million net outflow, triggering a cascade that smashed BTC below the critical $110,000 psychological barrier. The digital gold narrative faces its toughest test yet as Wall Street's shiny new crypto toys show their first major cracks.
Market Carnage Unfolds
Traders are scrambling as the ETF outflow tsunami wipes out recent gains. The $110,000 support level—once considered rock-solid—crumbled like a stale cookie. This isn't just a dip; it's a full-scale institutional retreat that's leaving retail holders holding the bag.
Reality Check for Crypto Bulls
While the true believers chant 'buy the dip,' the smart money is heading for the exits. Turns out Wall Street's love affair with crypto lasts exactly as long as the profits do—about as committed as your average Tinder date.
Spot BTC ETF outlook
According to SoSoValue data, U.S. spot Bitcoin ETFs saw $536.4 million in outflows on Oct. 16, their second day of withdrawals. ARK Invest’s ARKB led with $275 million in redemptions, followed by Fidelity’s FBTC with $132 million. Grayscale’s GBTC, BlackRock’s IBIT, and Bitwise’s BITB also recorded smaller losses.
These consecutive outflows imply that following Bitcoin’s recent surge, some institutions are reducing their exposure or locking in profits. When ETF redemptions rise, it often adds short-term selling pressure, especially when market sentiment is uncertain.
Bitcoin price technical analysis
Bitcoin’s short-term technical setup is fragile. The relative strength index at 37 suggests neutral-to-weak momentum, while momentum shows a mild buy signal, indicating that downside pressure may be slowing.
But every major moving average, from the 200-day SMA ($107,535) to the 10-day EMA ($112,885), flashes sell signals, indicating a persistent bearish bias.
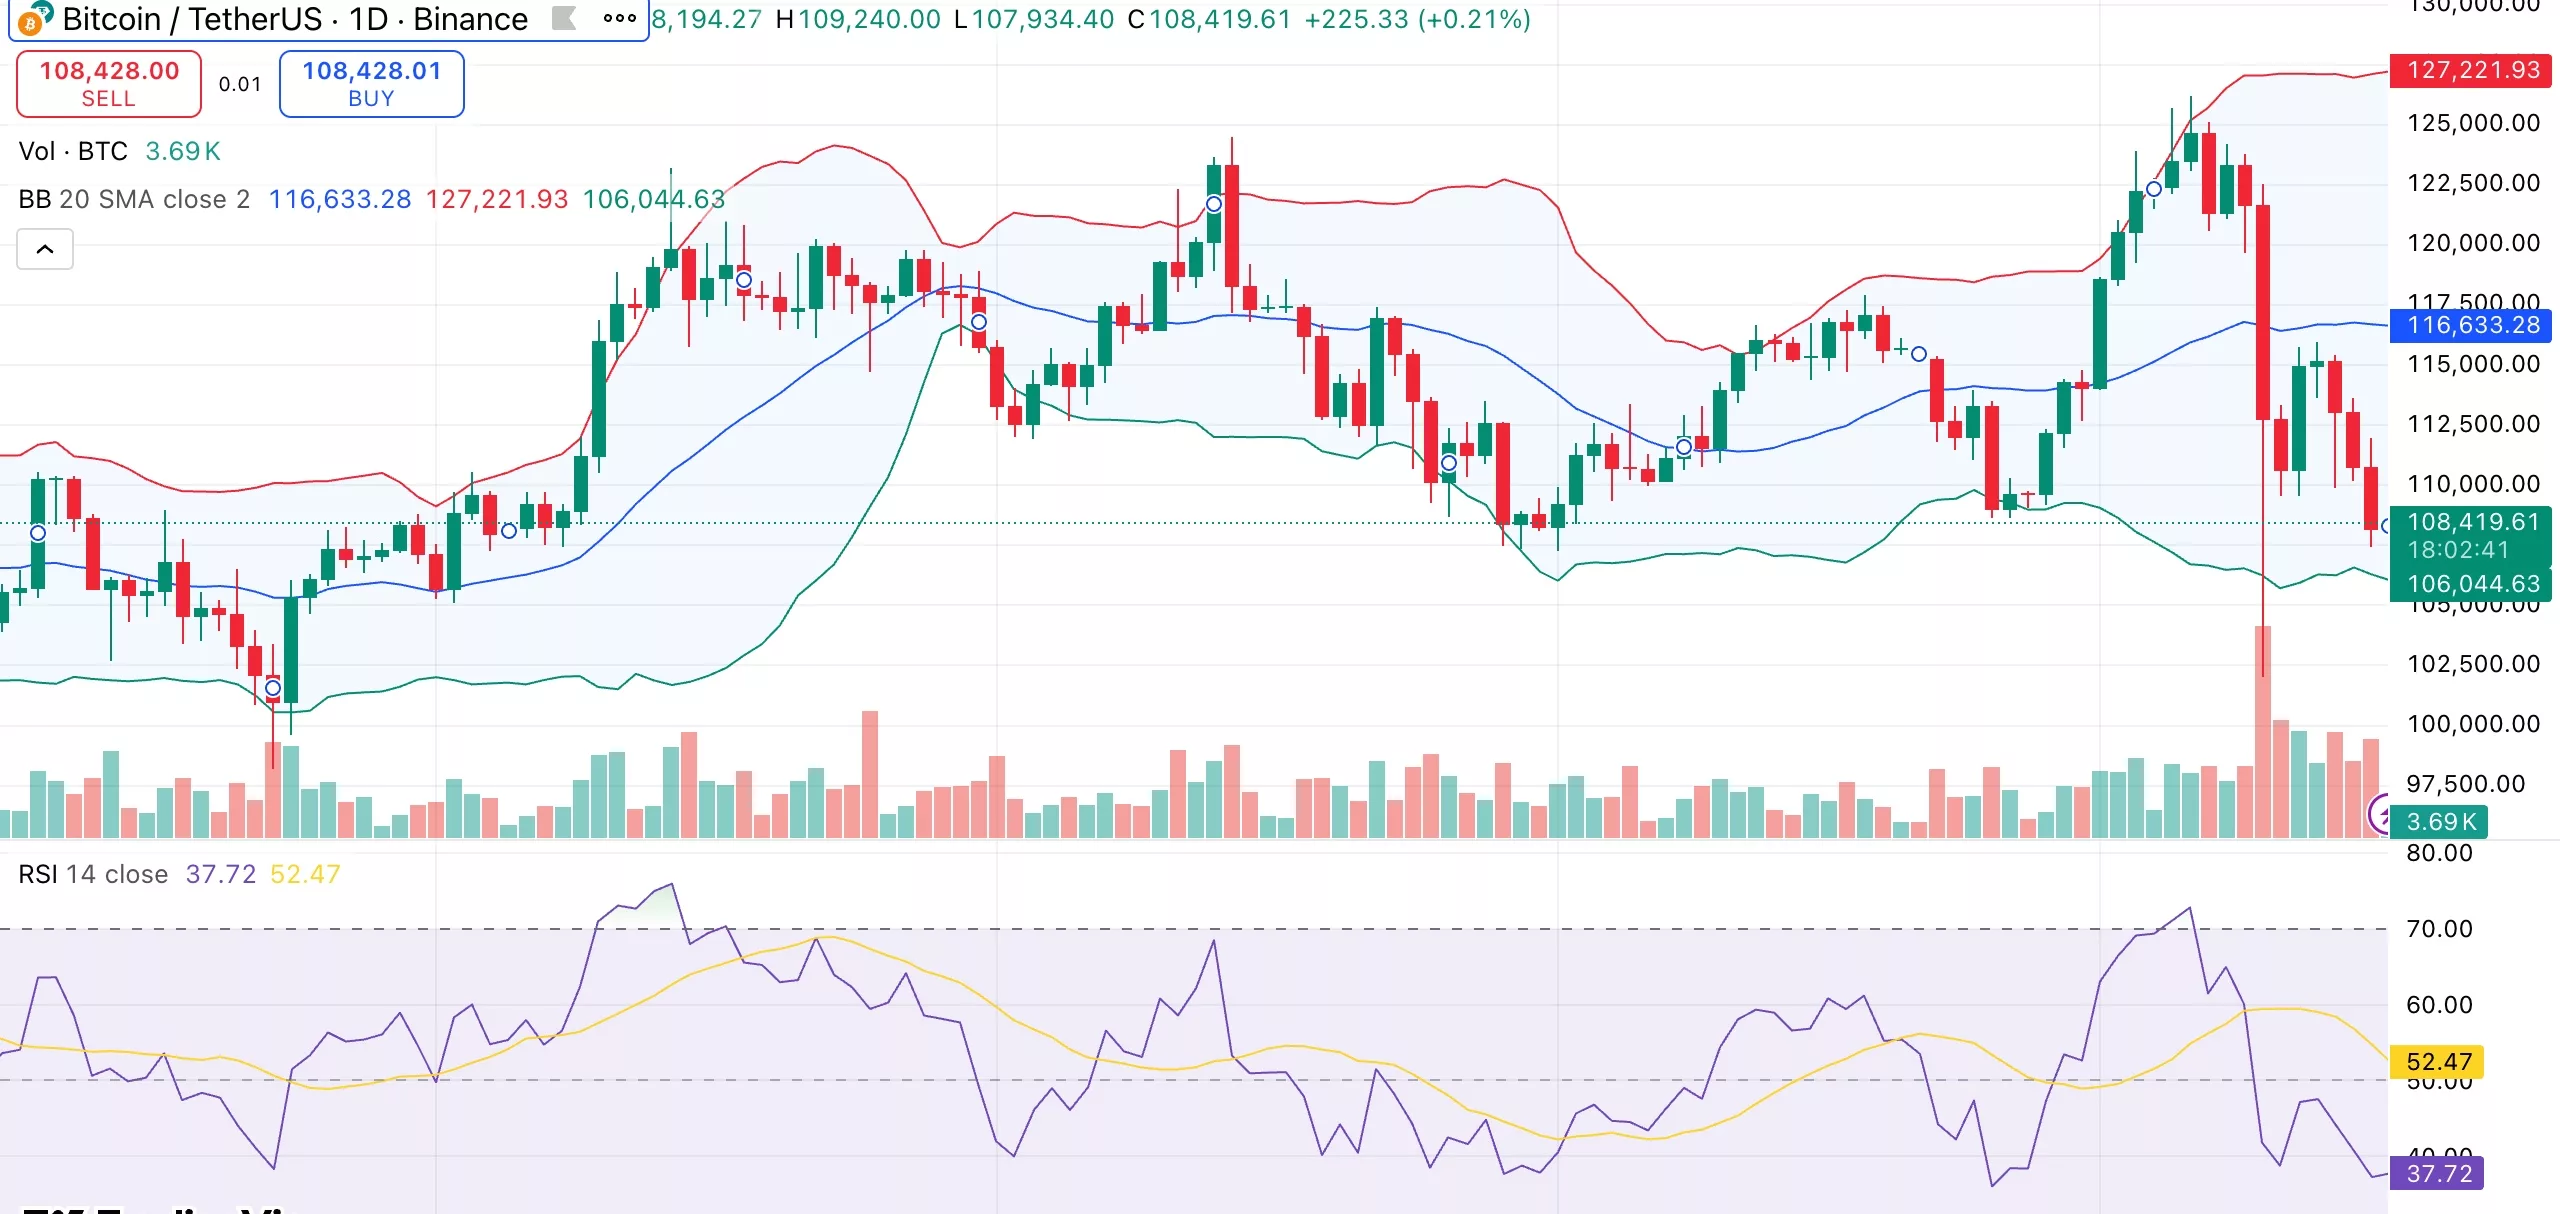
Bitcoin is hugging the lower Bollinger Bands and volatility is rising, which could indicate further movement if support breaks. The range of $108,000-$109,000 has emerged as a crucial level to monitor.
In the near future, bitcoin may rise back toward the $113,000- $115,000 zone if it stays at this level. While a breeak below this level may result in a move towards $104,000, it may also introduce new buyer interest.
If selling persists, some analysts, like Arthur Hayes, think a MOVE close to $100,000 is feasible. Others believe that the price will soon stabilize, citing the continued steady demand from long-term holders and ETFs.
