SPARK (SPK) Primed for Breakout—But Don’t Hold Your Breath for New ATHs Just Yet

SPARK (SPK) is teasing traders with a textbook pattern breakout—yet the champagne might stay on ice a while longer.
The Setup:
After weeks of consolidation, SPK's chart flashes the classic signs of an impending surge. Symmetrical triangle? Check. Volume building? Check. But here's the kicker: overhead resistance looms like a crypto VC at an ICO buffet.
The Reality Check:
While technicals scream 'buy,' the path to new all-time highs faces a wall of sell orders thicker than a Bitcoin maximalist's skull. Market makers aren't exactly rushing to flip the switch—not with macro uncertainty still doing the Macarena across risk assets.
The Bottom Line:
This could be your entry before the next leg up... or another 'breakout' that collapses faster than a DeFi protocol's TVL during a Fed meeting. (Pro tip: maybe wait for that daily close above resistance before YOLO-ing the mortgage.)
Exchange Inflows Say Profit‑Taking Risk Is Real
When a token nearly doubles in 24 hours, the first question is: Are holders starting to send coins to exchanges to sell? That is why the hourly netflow chart matters here.
SPK netflows have stayed positive through the run, which means deposits are still outpacing withdrawals while price is elevated.
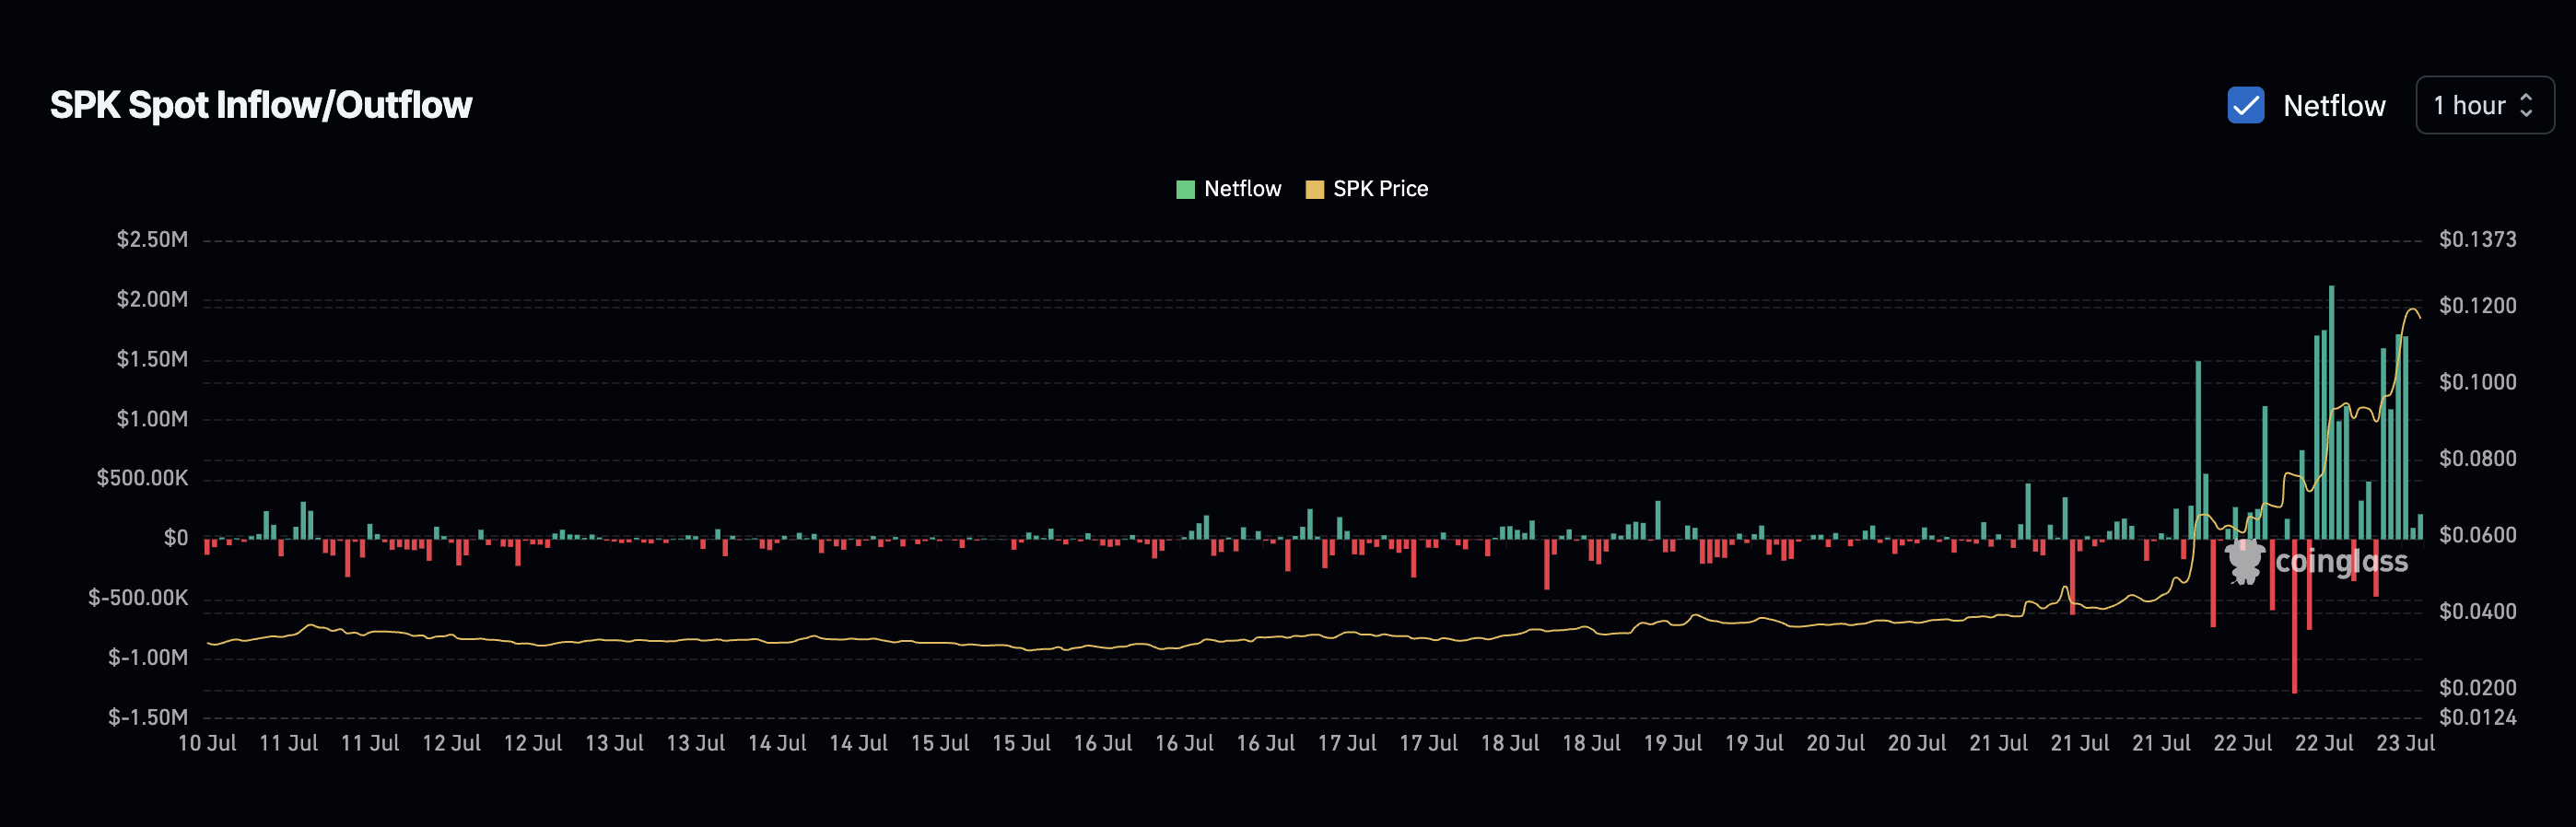
Prices have already slipped a bit, so if inflows keep building, those extra coins on exchanges can become sell orders fast.
Netflow simply tracks tokens moving in or out; persistent inflows while price stalls usually hint that a pullback is on deck, even inside a bullish trend.
RSI Has to Lead for the Breakout to Stick
We analyse the 1‑hour Relative Strength Index (RSI) because this MOVE is news‑driven and momentum shifts quickly at that scale. Plus, the hourly view can help foresee any trend before it moves to the daily or even the 4-hour timeline.
Last time, between July 21 and 22, RSI made a higher high right as price nudged up, and that alignment kicked off the bigger rally.
Right now, Spark Price is hugging the top of an ascending wedge, but RSI is stuck around 80 without taking out its last peak. Price zone is the same, but the momentum is weaker.
: Want more token insights like this? Sign up for Editor Harsh Notariya’s Daily crypto Newsletter here.
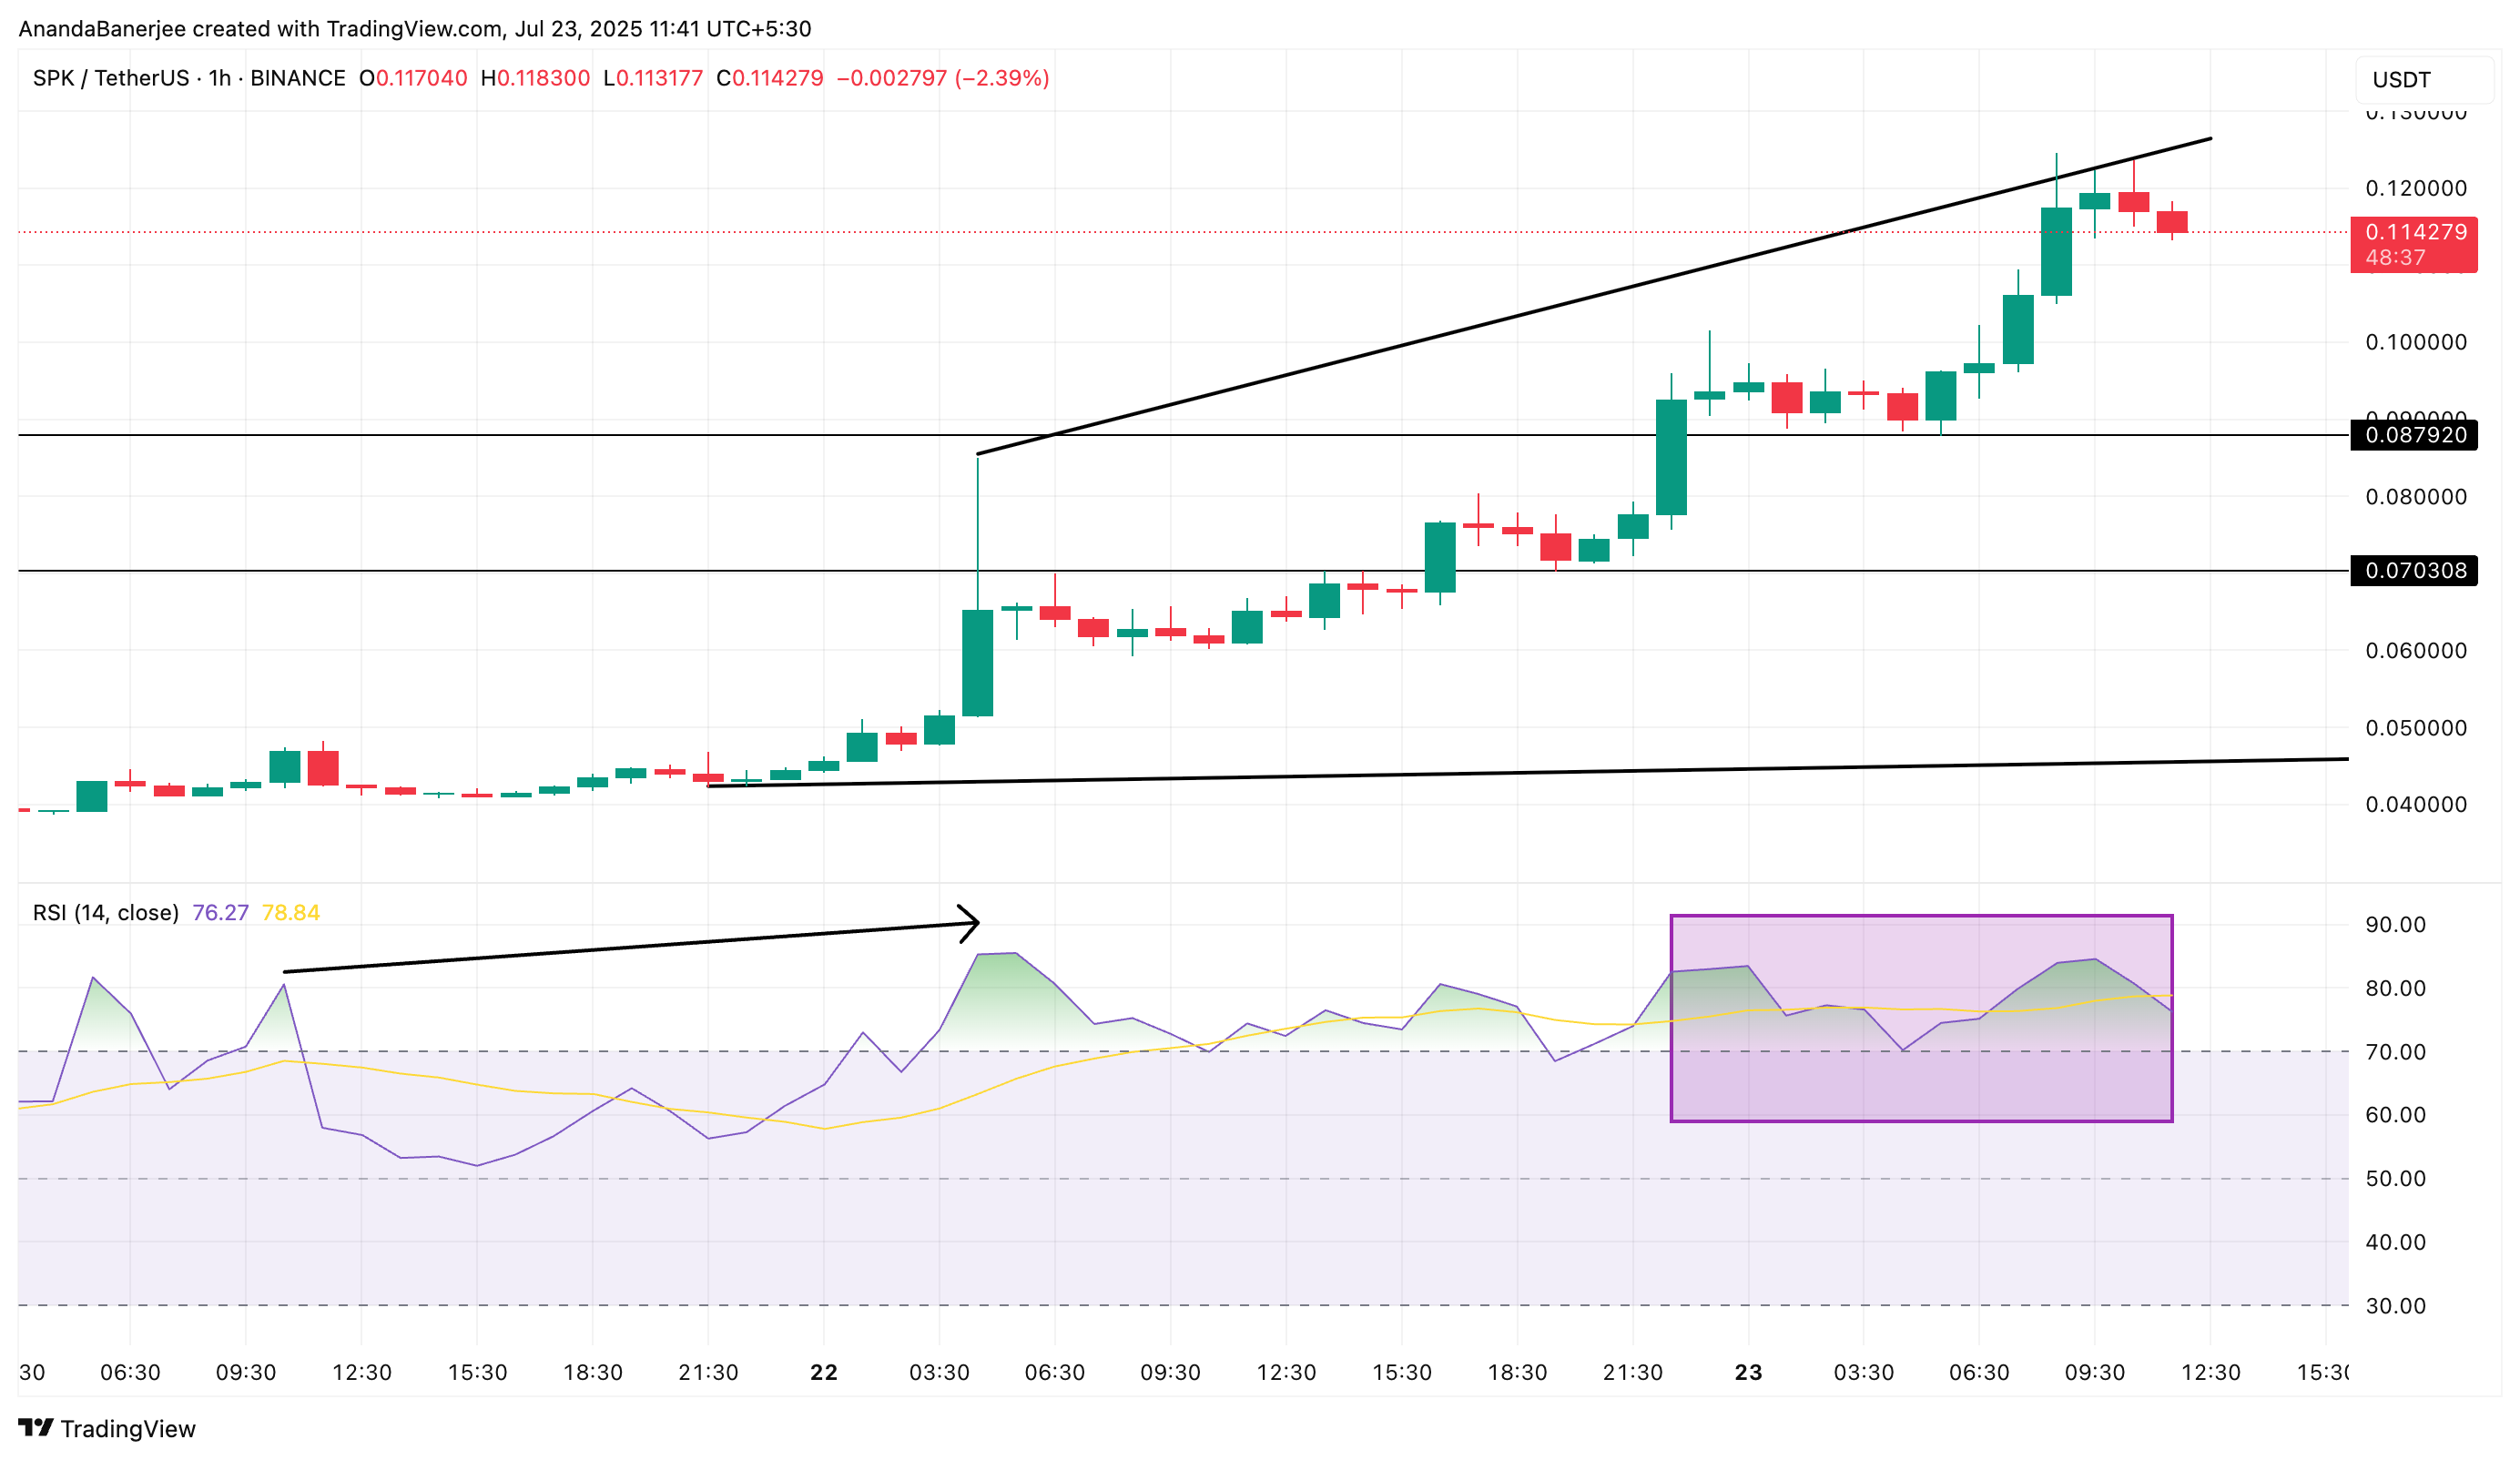
If RSI cannot print a higher high with price, a dip is more likely to occur.
RSI (Relative Strength Index) scores the strength of recent moves from 0 to 100; when price is flat or rising but RSI fades, momentum is not backing the push.
SPK Price Action: $0.124 Is the Trigger
The upper edge of that wedge lines up almost perfectly with the 0.618 mark of a trend‑based Fibonacci extension NEAR $0.124, giving a clean validation level for Spark Token traders.
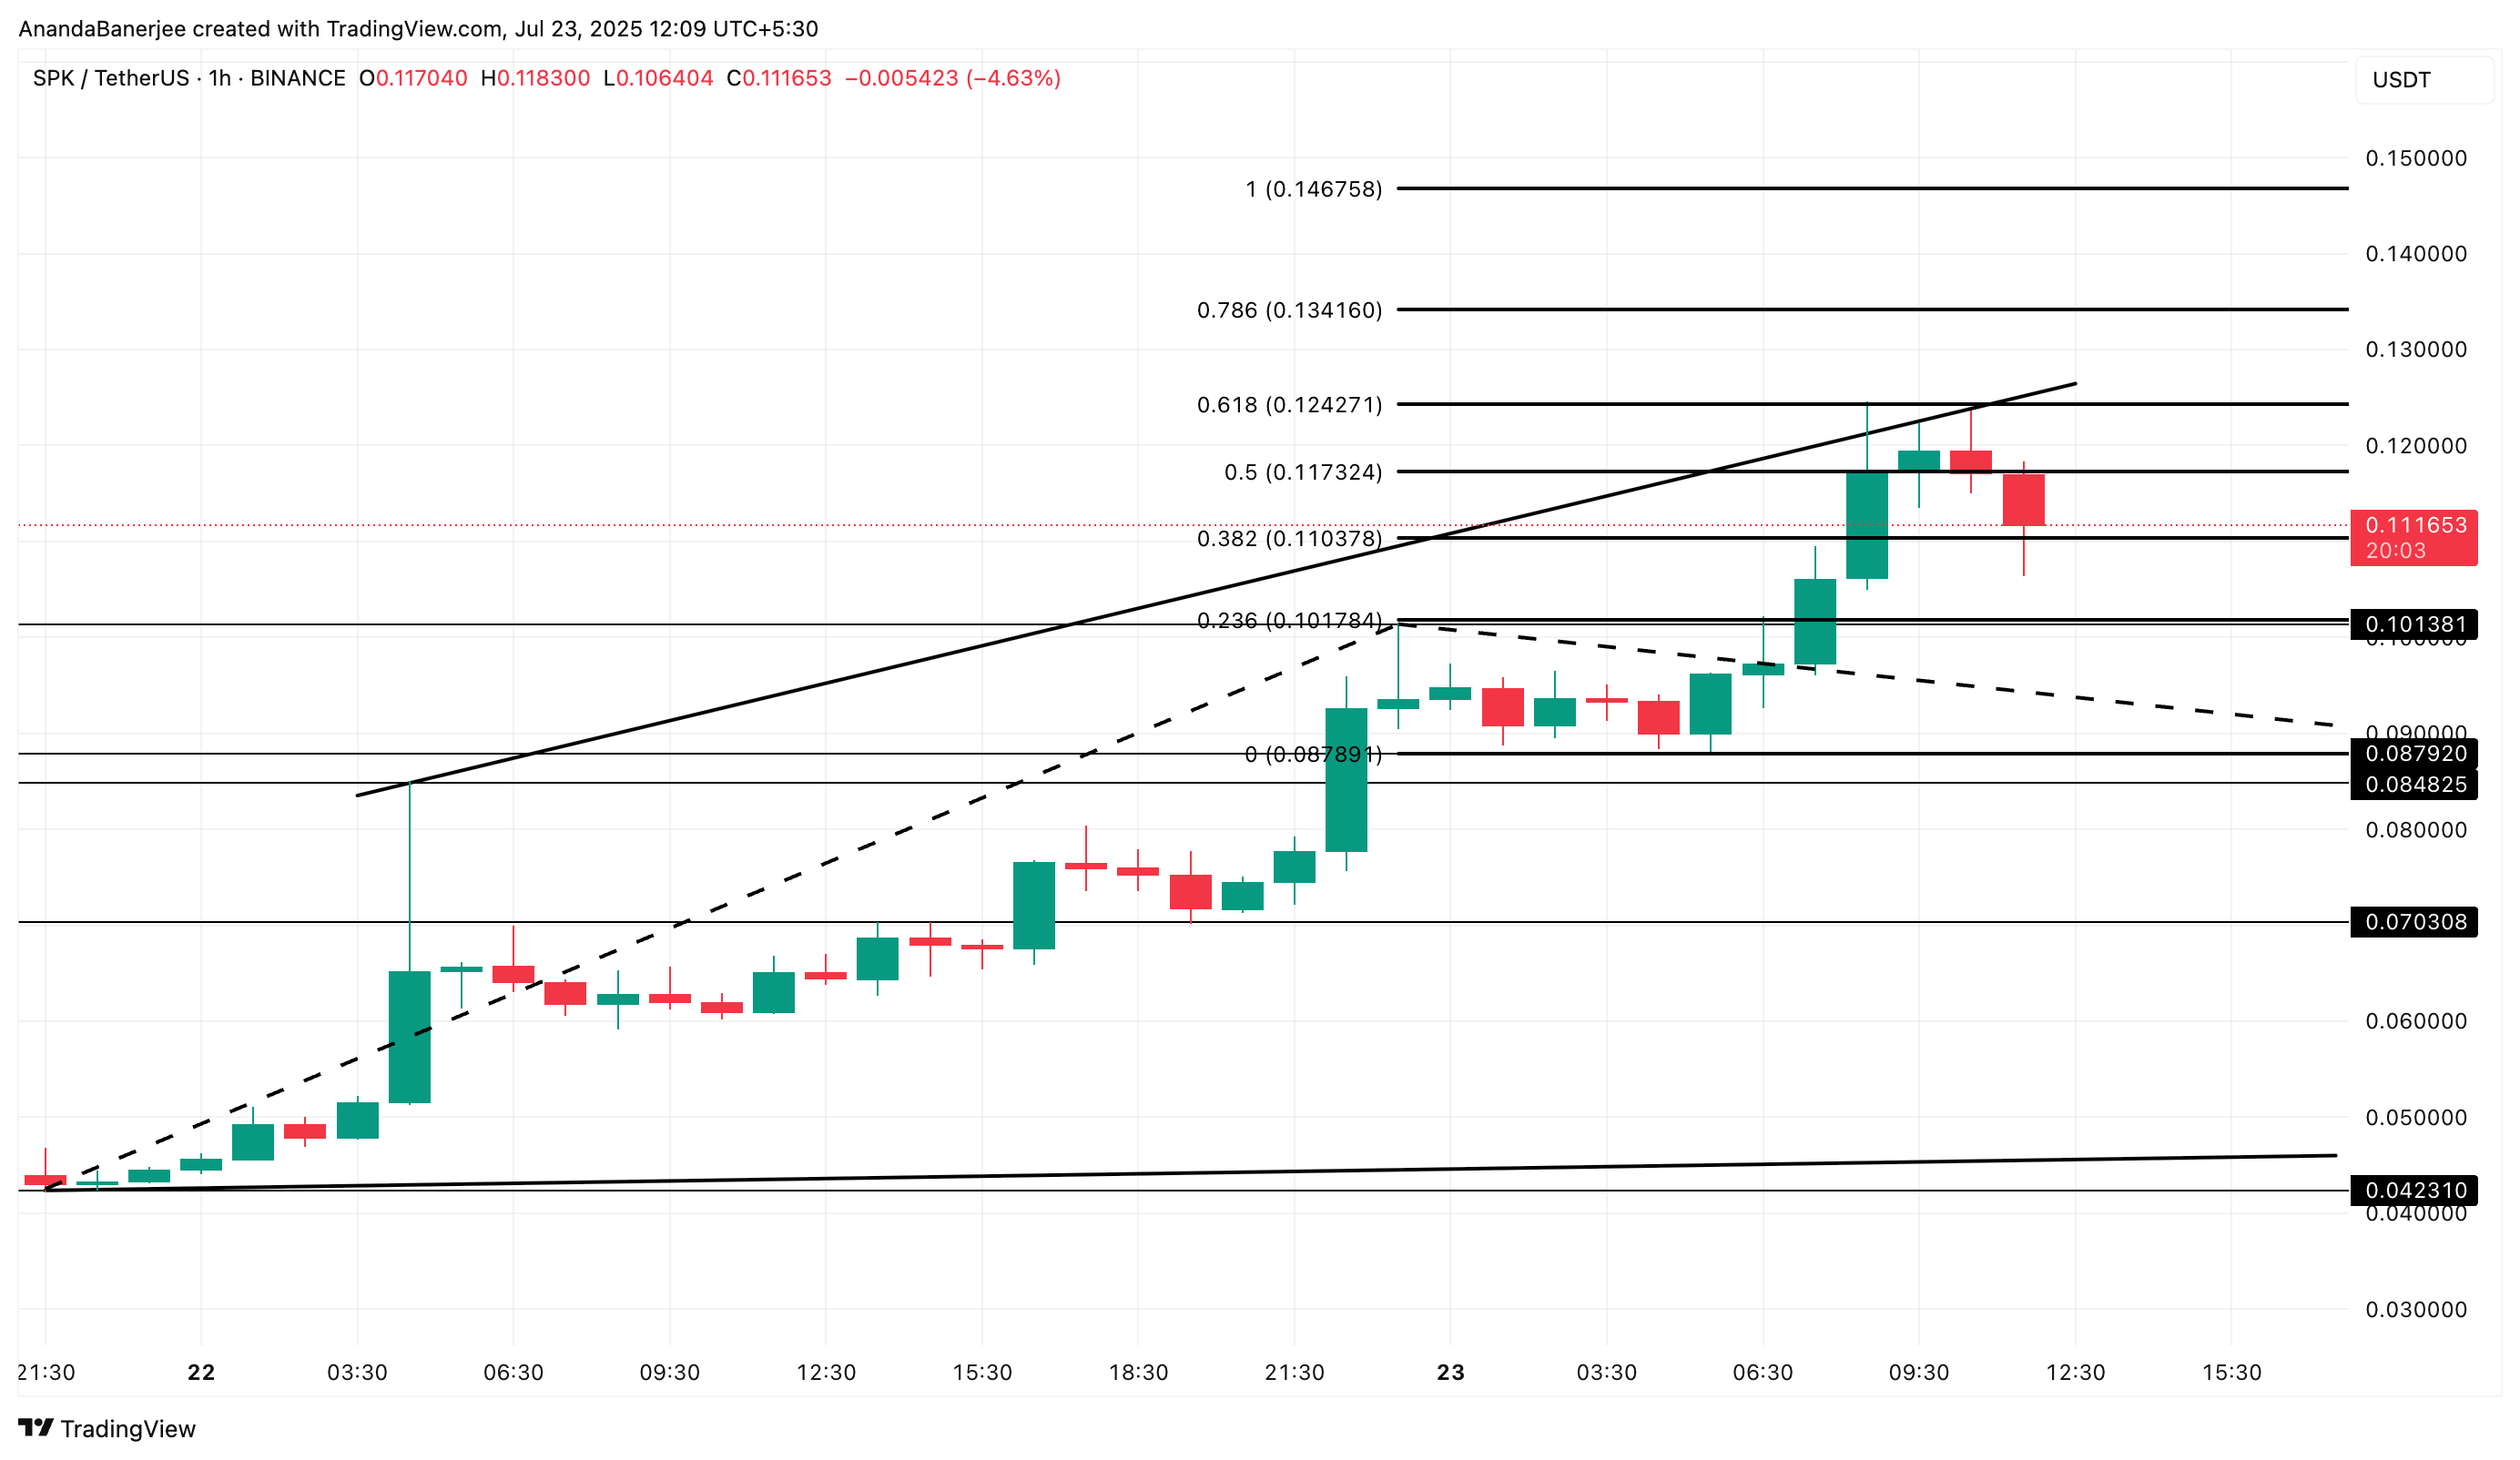
SPK has failed there twice. It has already slipped from $0.117 to about $0.111, so $0.110 is the first level bulls need to defend.
Lose it, and price might gravitate to $0.101, the earlier swing high used to anchor the Fib.
Below that sits $0.087 (the 0 Fib line). The broader bullish structure survives above that zone, but if SPK breaks under it, $0.070 comes into play and the uptrend weakens.
Flip side: a clean hourly close above $0.124, with RSI breaking higher and hourly inflows cooling, WOULD clear the path for continuation and another all‑time high in SPK Price.
