Bitcoin Breakout Alert: 10x Research Predicts Multi-Week Rally to $110K

Bitcoin's price action just flashed a major signal, and one prominent analytics firm is calling for a sustained surge. 10x Research sees the setup for a multi-week advance that could propel the flagship cryptocurrency toward a staggering $110,000 target.
The Technical Catalyst
Forget the daily noise. The real story is unfolding on the higher timeframes. Analysts point to a decisive breakout from a key consolidation pattern—a move that historically precedes significant trending periods. This isn't about a quick pump; it's about structural momentum shifting in the bulls' favor.
Why $110K Isn't Just Hype
The $110,000 figure isn't plucked from thin air. It aligns with measured move projections from the recent trading range and intersects with major Fibonacci extension levels. In simpler terms: the math supports the narrative. If buying pressure sustains, the path toward six figures becomes technically validated, not just hopeful speculation.
Navigating the Rally
A "multi-week" rally implies volatility, not a straight line up. Expect pullbacks—they're fuel for the next leg higher. The key for traders is to identify robust support zones on any dips. For long-term holders, it's a reminder that patience during consolidation is often rewarded when the market finally picks a direction and runs with it.
While Wall Street fiddles with spreadsheets and debates basis points, Bitcoin is quietly engineering its next paradigm shift. The signal is clear. The target is set. Whether traditional finance is ready or not, the digital asset engine is revving up for a run that could redefine value yet again.
Bitcoin is currently going through a calm but tense phase as it faces $23.6 billion in option expiry today. After weeks of heavy selling in October and November, the market is trying to find stability.
According to recent analysis from 10x Research, Bitcoin has triggered a bullish breakout that may signal the start of a multi-week recovery, with upside potential toward $110K if momentum holds.
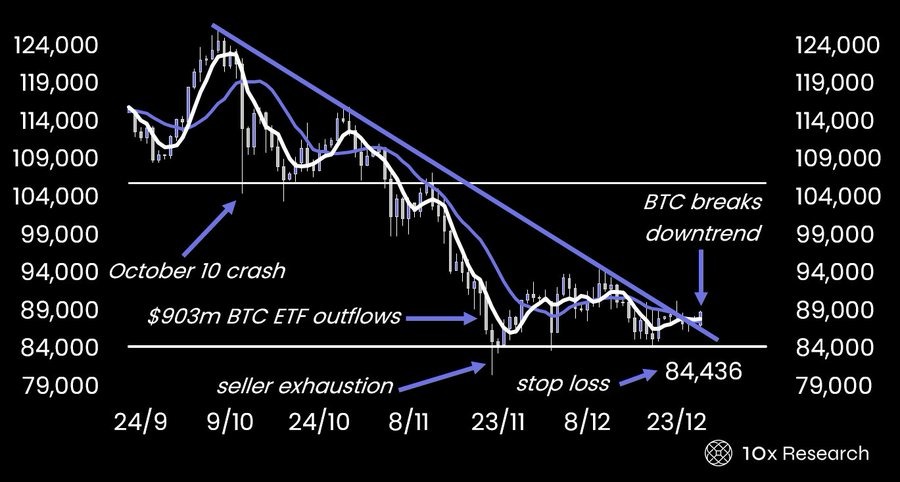
October Crash and ETF Outflows Weighed Heavily on Bitcoin
According to 10x Research, Bitcoin’s current price structure began with the sharp October 10 crash, when BTC fell from its peak near $98,000, and the broader crypto market saw about $19 billion in liquidations.
Pressure increased after the October 29 Federal Reserve meeting, which delivered a hawkish message. Soon after, spot bitcoin ETFs recorded heavy selling, with nearly $903 million in net outflows. This drained liquidity and kept Bitcoin stuck under selling pressure.
Even when prices looked attractive, buyers remained cautious. As a result, the downtrend lasted longer than many traders expected.
By late November, selling began to fade as most short-term sellers had exited. However, instead of rebounding, capital shifted to assets like Gold and silver, leaving Bitcoin stuck in a slow recovery.
$85,000 Becomes a Strong Support Level
From a chart perspective, Bitcoin recently moved above its descending trendline, signaling potential trend exhaustion. Key support NEAR the $85,000 zone held firm, strengthening buyer confidence. As long as Bitcoin stays above this zone, the market avoids deeper losses.
Even though Bitcoin has tried to MOVE above $92K but failed several times, one major reason is low trading volume, which is common near year-end.
With fewer traders active, price moves lack strength. As a result, recent rises look like short pauses, not a true trend shift.
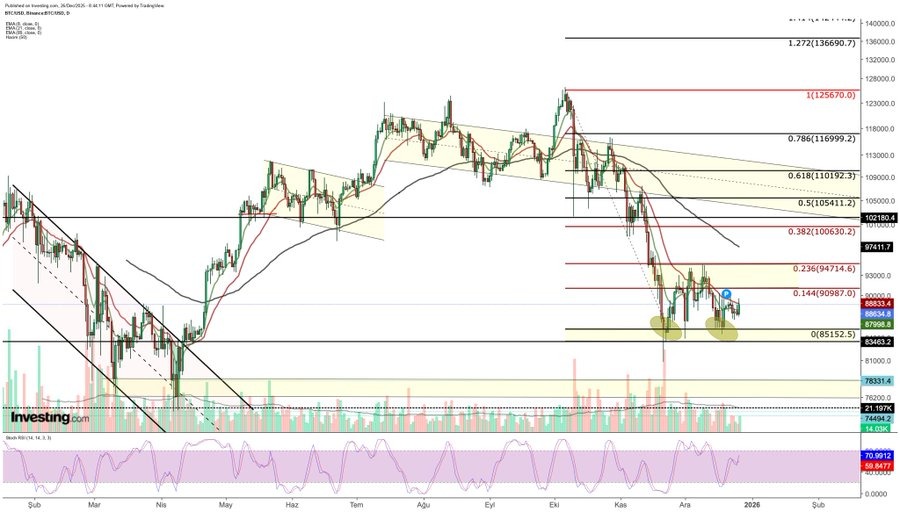
Resistance Levels Hold the $110000 Level Back
On the upside, Bitcoin faces heavy resistance. The first level to watch is $91,000, which could signal the end of consolidation if broken. The bigger hurdle lies near $94,700, a key level that could shift market sentiment.
If Bitcoin clears these zones, upside targets sit near $100,600, $105,400, and $110,000.
As of now, BTC is trading $88,656, reflecting a jump of 1.5% seen in the last $1.77 trillion.
